
Chapter 8: Introduction to Well Control#
Learning Objectives#
By the end of this chapter, you will be able to:
Define the key terms used in well control: kick, blowout, shut-in, barrier, SIDPP, SICP, and MAASP
Distinguish between primary, secondary, and tertiary well control
Identify the primary and secondary barriers used in a well control system
Explain why formations are normally pressured, sub-normally pressured, or over-pressured, and describe gas effect
Construct and interpret a pressure vs. depth plot for a wellbore
Explain why drilling fluid density is the primary tool for primary well control
Describe the consequences of mud weight that is too low (kick) or too high (lost circulation)
Define the leak-off test (LOT), explain why it is conducted, and interpret its results
Define the Maximum Allowable Annular Surface Pressure (MAASP)
Explain the mechanisms of high-volume and low-volume swabbing
Describe the steps for shutting in a well after detecting a kick
Differentiate between the Driller’s Method and the Wait-and-Weight Method for well kill operations
Calculate shut-in drillpipe pressure (SIDPP), shut-in casing pressure (SICP), and infer kick density
8.1 Introduction: Why Well Control Matters#
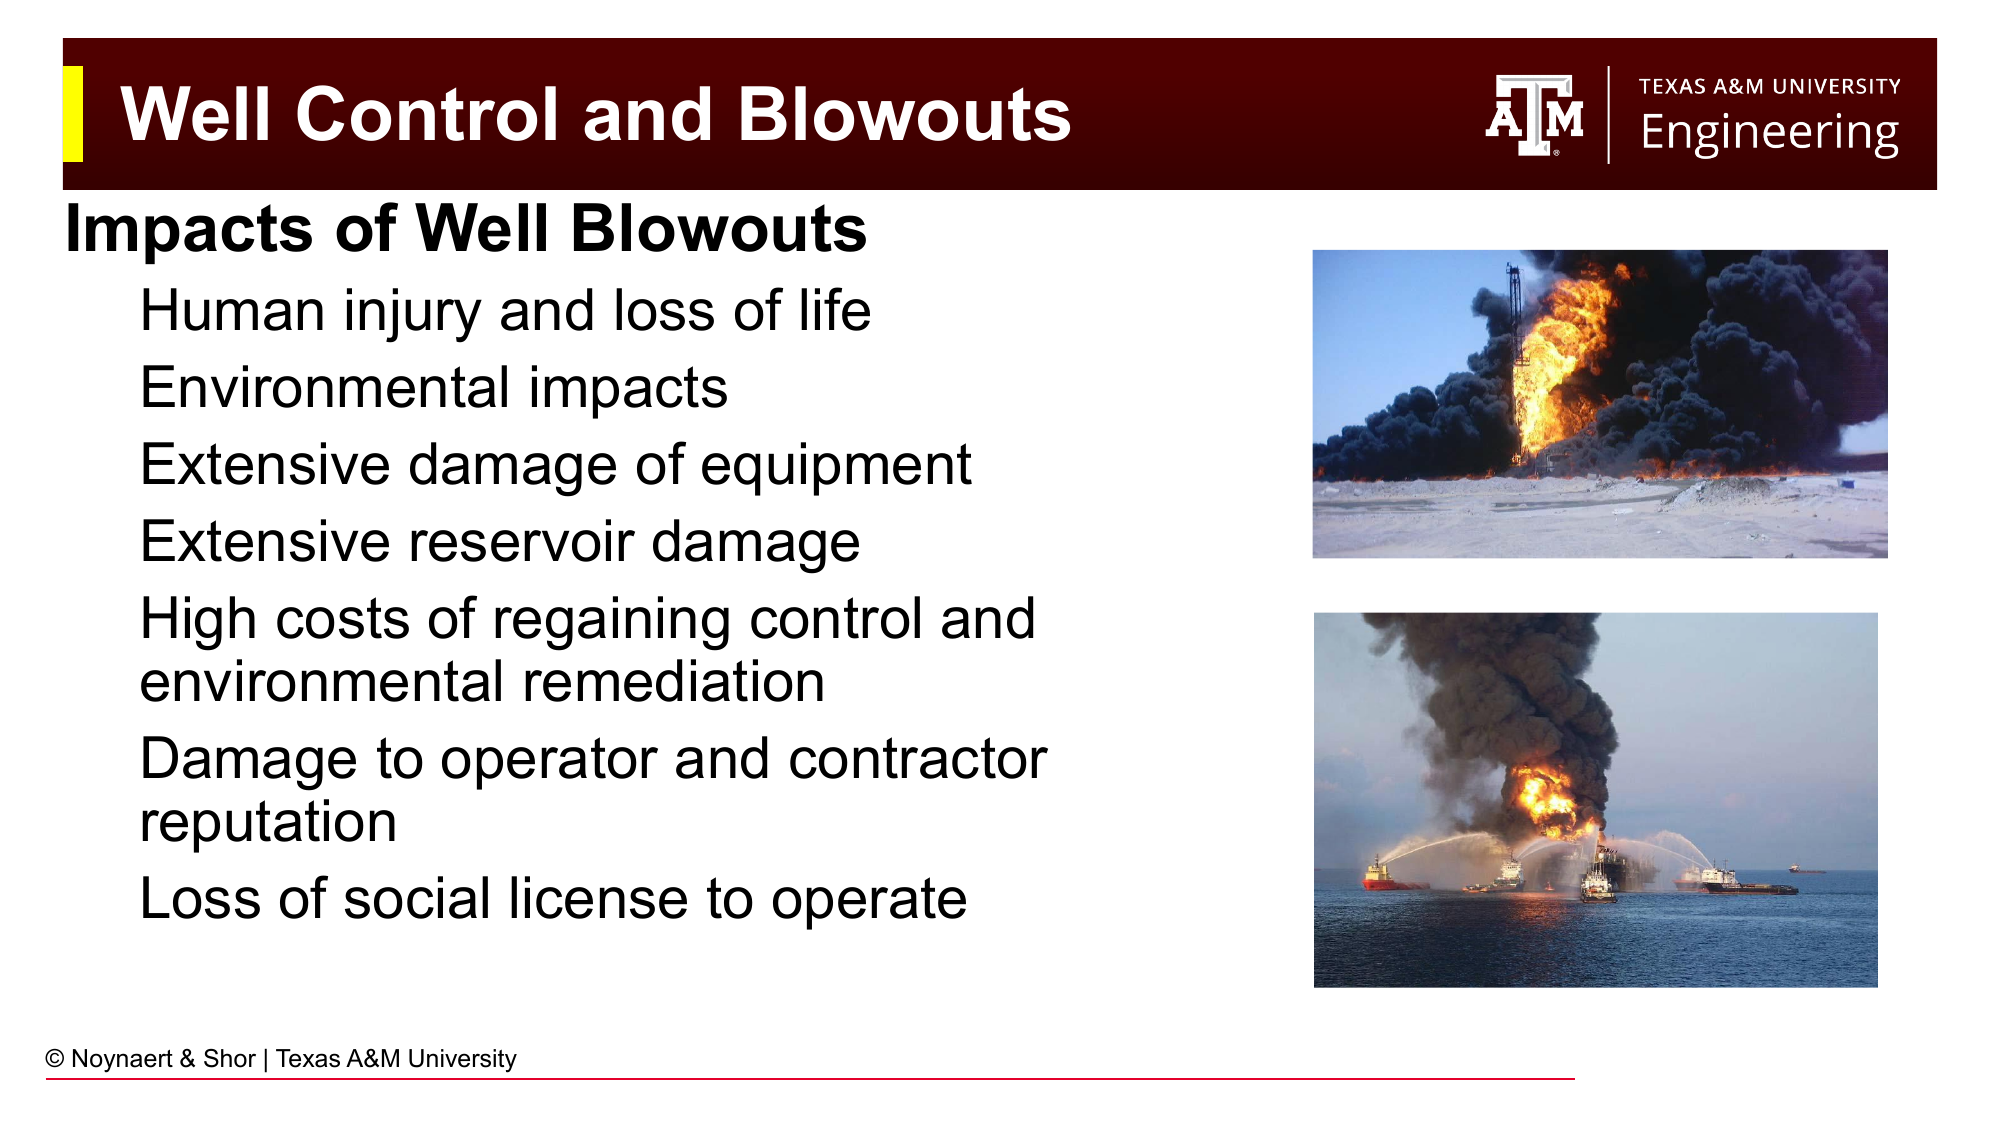
Fig. 102 The impacts of a blowout extend far beyond the immediate safety emergency. Human casualties, environmental damage, equipment losses, reservoir damage, and reputational harm to the operator and the industry can persist for years after the event.#
Well control is not a specialized or advanced topic in drilling engineering — it is the application of the knowledge from the preceding chapters. Every decision about mud weight and hydraulics effect bottom hole pressure, which in turn keeps formation fluids where they belong, inside the formation. Remember, the number one function of drilling fluid is to provide hydrostatic pressure for primary well control.
The consequences of losing well control range from a manageable flow of formation fluid into the wellbore (a kick that initiates a planned response) to an uncontrolled blowout at surface, one of the most severe industrial accidents possible. The Macondo blowout on April 20, 2010 killed 11 workers and caused the largest offshore oil spill in US history. The 1977 Ekofisk blowout in the North Sea required months to control. In each case, the physical events leading to the blowout began with a failure of well control barriers that were either inadequately designed, improperly applied, or both.
Well control is also an economic matter. Every barrel of oil burning at the surface is lost revenue. Regaining control of a blowout costs tens to hundreds of millions of dollars. The social license for the industry to operate depends on the public’s confidence that blowouts are rare and well-managed; a confidence that is severely damaged every time one occurs.
Finally, loss of well control can have severe environmental consequences. Macondo blowout released between 3.19 and 4.2 million barrels of crude oil over 87 days into the Gulf of Mexico. Millions of birds and animals were killed or injured in the months that followed and over 1,300 miles of beaches in Texas and Louisiana were affected. Clean up efforts continued for years, and some impacts of the subsea plume of oil are continuing to be felt by the gulf ecosystems today.
8.2 Definitions#
Key Term: Kick
A kick is a temporary, detectable inflow of formation fluid (oil, gas, water, or a combination) into the wellbore caused by the bottomhole pressure falling below the formation pore pressure. A kick is a primary well control event, it should be planned for and kicks can be managed safely with proper procedures.
Key Term: Blowout
A blowout is an uncontrolled flow of formation fluids to the surface (or underground blowout: from one formation to another). A blowout results from failure to detect and respond to a kick before formation fluid reaches the surface. An underground blowout is uncontrolled flow from a high-pressure formation into a lower-pressure zone — it does not reach the surface but can be equally damaging.
Key Terms: Shut-in and Barriers
Shutting in the well means sealing the wellbore at surface using blowout preventers (BOPs) to stop the flow of formation fluids toward the surface while preserving access to the well through the drill pipe.
A well control barrier is any system — fluid or mechanical — that controls downhole pressures and prevents uncontrolled flow from reaching surface.
Well control indicators are systems that measure or detect the occurrence of uncontrolled flow in the wellbore, triggering the crew to take control action.
8.2.1 Primary, Secondary, and Tertiary Well Control#
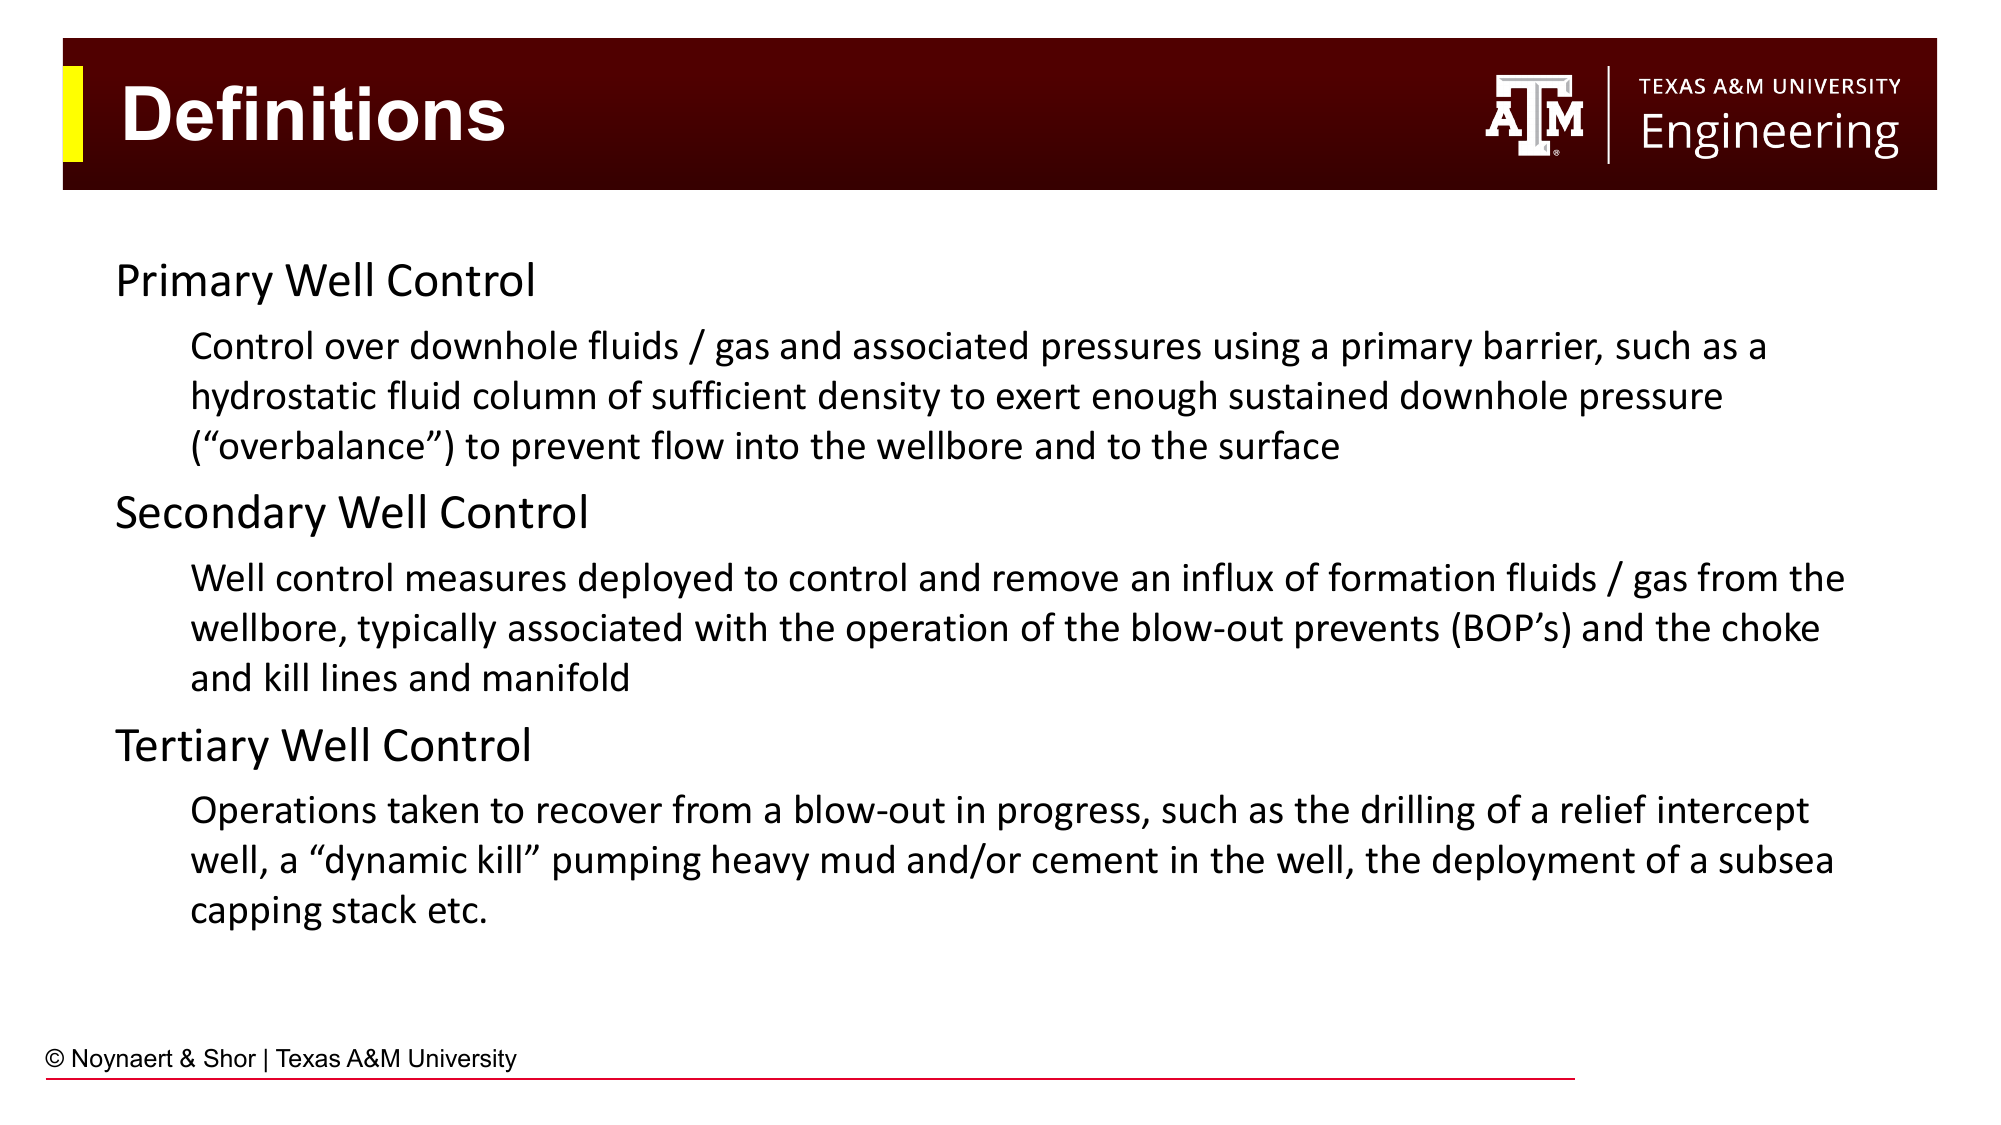
Fig. 103 The three levels of well control (primary, secondary, tertiary) and the barriers associated with each. Primary well control is the goal; secondary is the planned response when primary fails; tertiary is the last resort when a blowout is already in progress.#
Primary well control uses the hydrostatic pressure of the drilling fluid to overbalance the pore pressure of all formations open to the wellbore. As long as the bottomhole pressure from the mud column exceeds the formation pore pressure at every open interval, no formation fluid can enter the wellbore. Primary well control is the continuous, passive state of the well during normal drilling operations.
Secondary well control is deployed when primary well control has been temporarily lost — that is, when formation fluid has entered or is entering the wellbore (a kick). Secondary well control uses mechanical barriers (BOPs, choke and kill manifold) and active pumping operations to stop the influx, safely circulate the kick from the wellbore, and restore primary well control.
Tertiary well control is the last resort, deployed when a blowout is in progress and the rig itself may be compromised or lost. It includes operations like drilling a relief well to intersect the blowing well and kill it from below with heavy fluid or cement.
8.2.2 Well Control Barriers#
Fluid barriers:
Drilling mud of sufficient density to overbalance all open formations
Kill-weight brine (non-particulate) used where solids could damage the reservoir
Dynamic fluid column: continuous replacement of fluid under total-loss conditions
Mechanical barriers:
Cemented casing strings (providing zonal isolation of already-drilled formations)
Cement plugs
Blowout preventers (BOPs)
A properly designed well always has multiple independent barriers in place simultaneously. The concept of barrier management — ensuring that at no time is the well open to flow with fewer than two independent barriers — is a regulatory requirement in most jurisdictions.
8.3 Formation Pressures#
Understanding where formation pressure comes from — and why it sometimes deviates from the expected “normal” gradient — is the foundation of well control design.
8.3.1 Pressure vs. Depth#
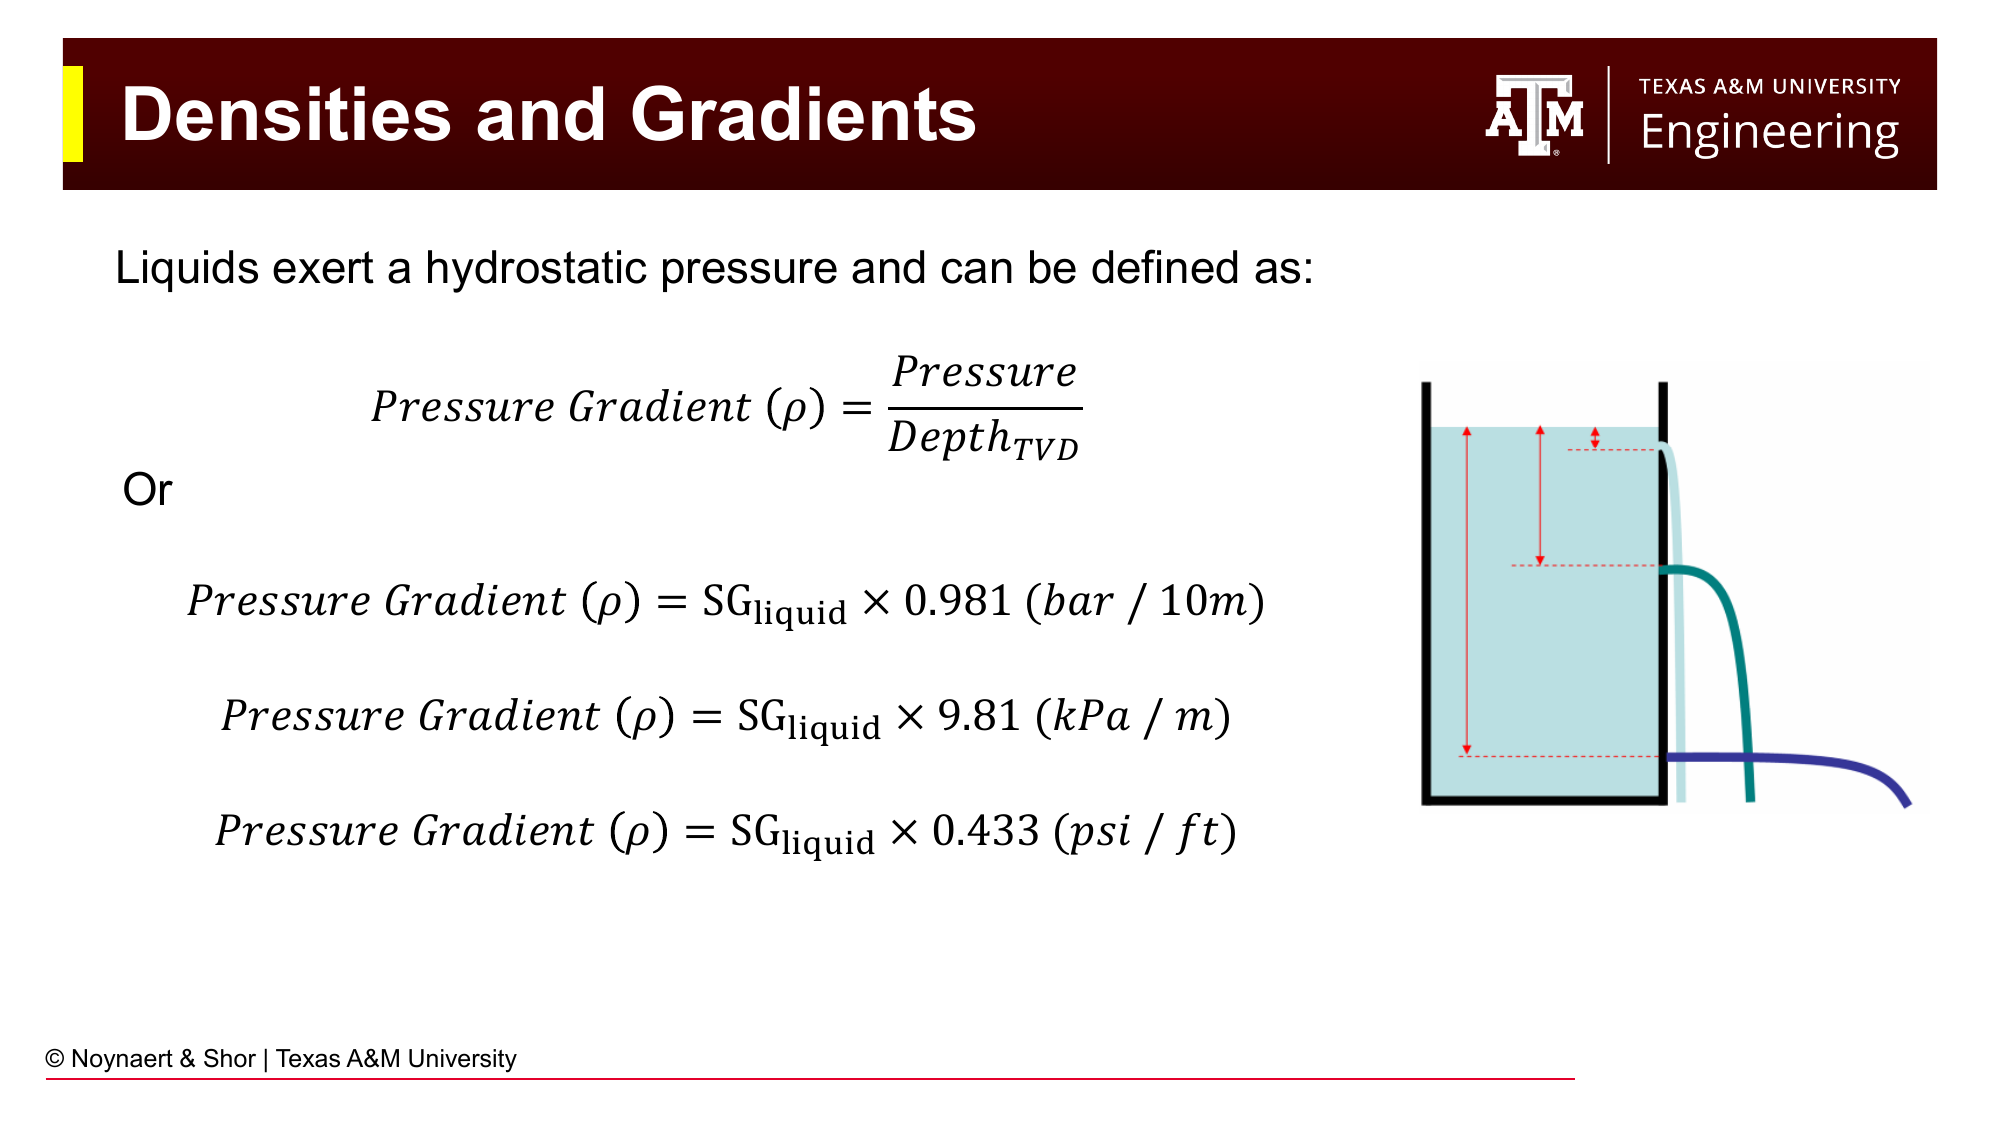
Fig. 104 Pressure vs. true vertical depth (TVD) for a fluid column. The slope of the line equals the fluid density (pressure gradient). Fresh water has a gradient of 0.433 psi/ft; drilling mud at 12 ppg has a gradient of 0.624 psi/ft.#
Fluid pressure at a given depth in a connected fluid system increases linearly with depth. The slope of the pressure–depth line is the pressure gradient, which equals the fluid density in pressure-per-unit-depth units:
Fluid |
SG |
Gradient (psi/ft) |
Gradient (ppg EMW) |
|---|---|---|---|
Fresh water |
1.00 |
0.433 |
8.34 |
Seawater |
1.03 |
0.446 |
8.59 |
Typical brine (NaCl) |
1.10–1.15 |
0.476–0.498 |
9.16–9.58 |
Oil (light) |
0.80 |
0.346 |
6.66 |
Gas (methane, 3000 psi) |
~0.15 |
0.065 |
1.25 |
8.3.2 Normally Pressured Formations#
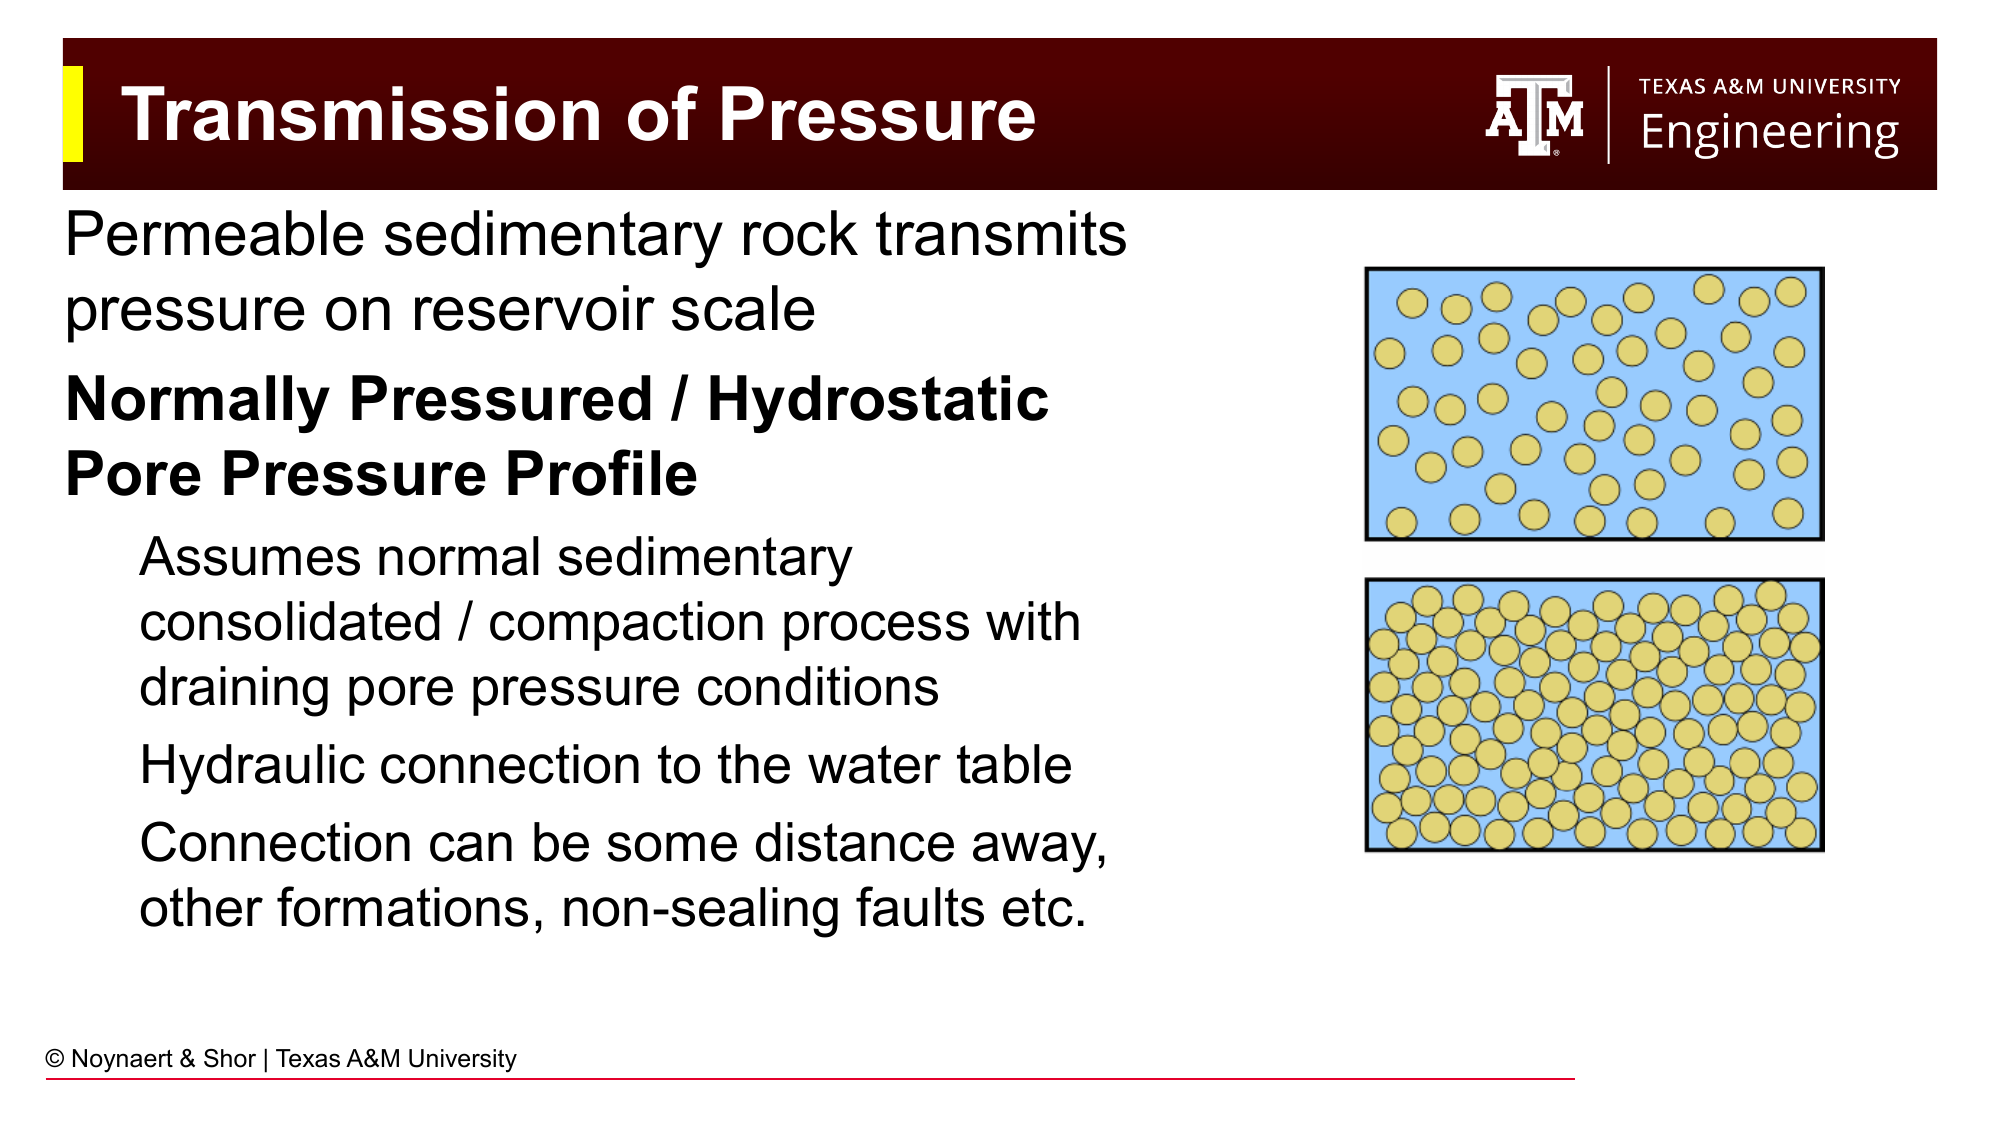
Fig. 105 Pressure is transmitted through permeable rock in the same way it is transmitted through a connected fluid system. A normally pressured formation is one that is hydraulically connected (perhaps through a long, indirect path) to a water table or the ocean floor at approximately the same elevation.#
A normally pressured (hydrostatic) formation is one whose pore fluid is connected, through permeable pathways, to a surface water body at approximately the same elevation as the rig. The pore pressure is simply the weight of the water column above the formation.
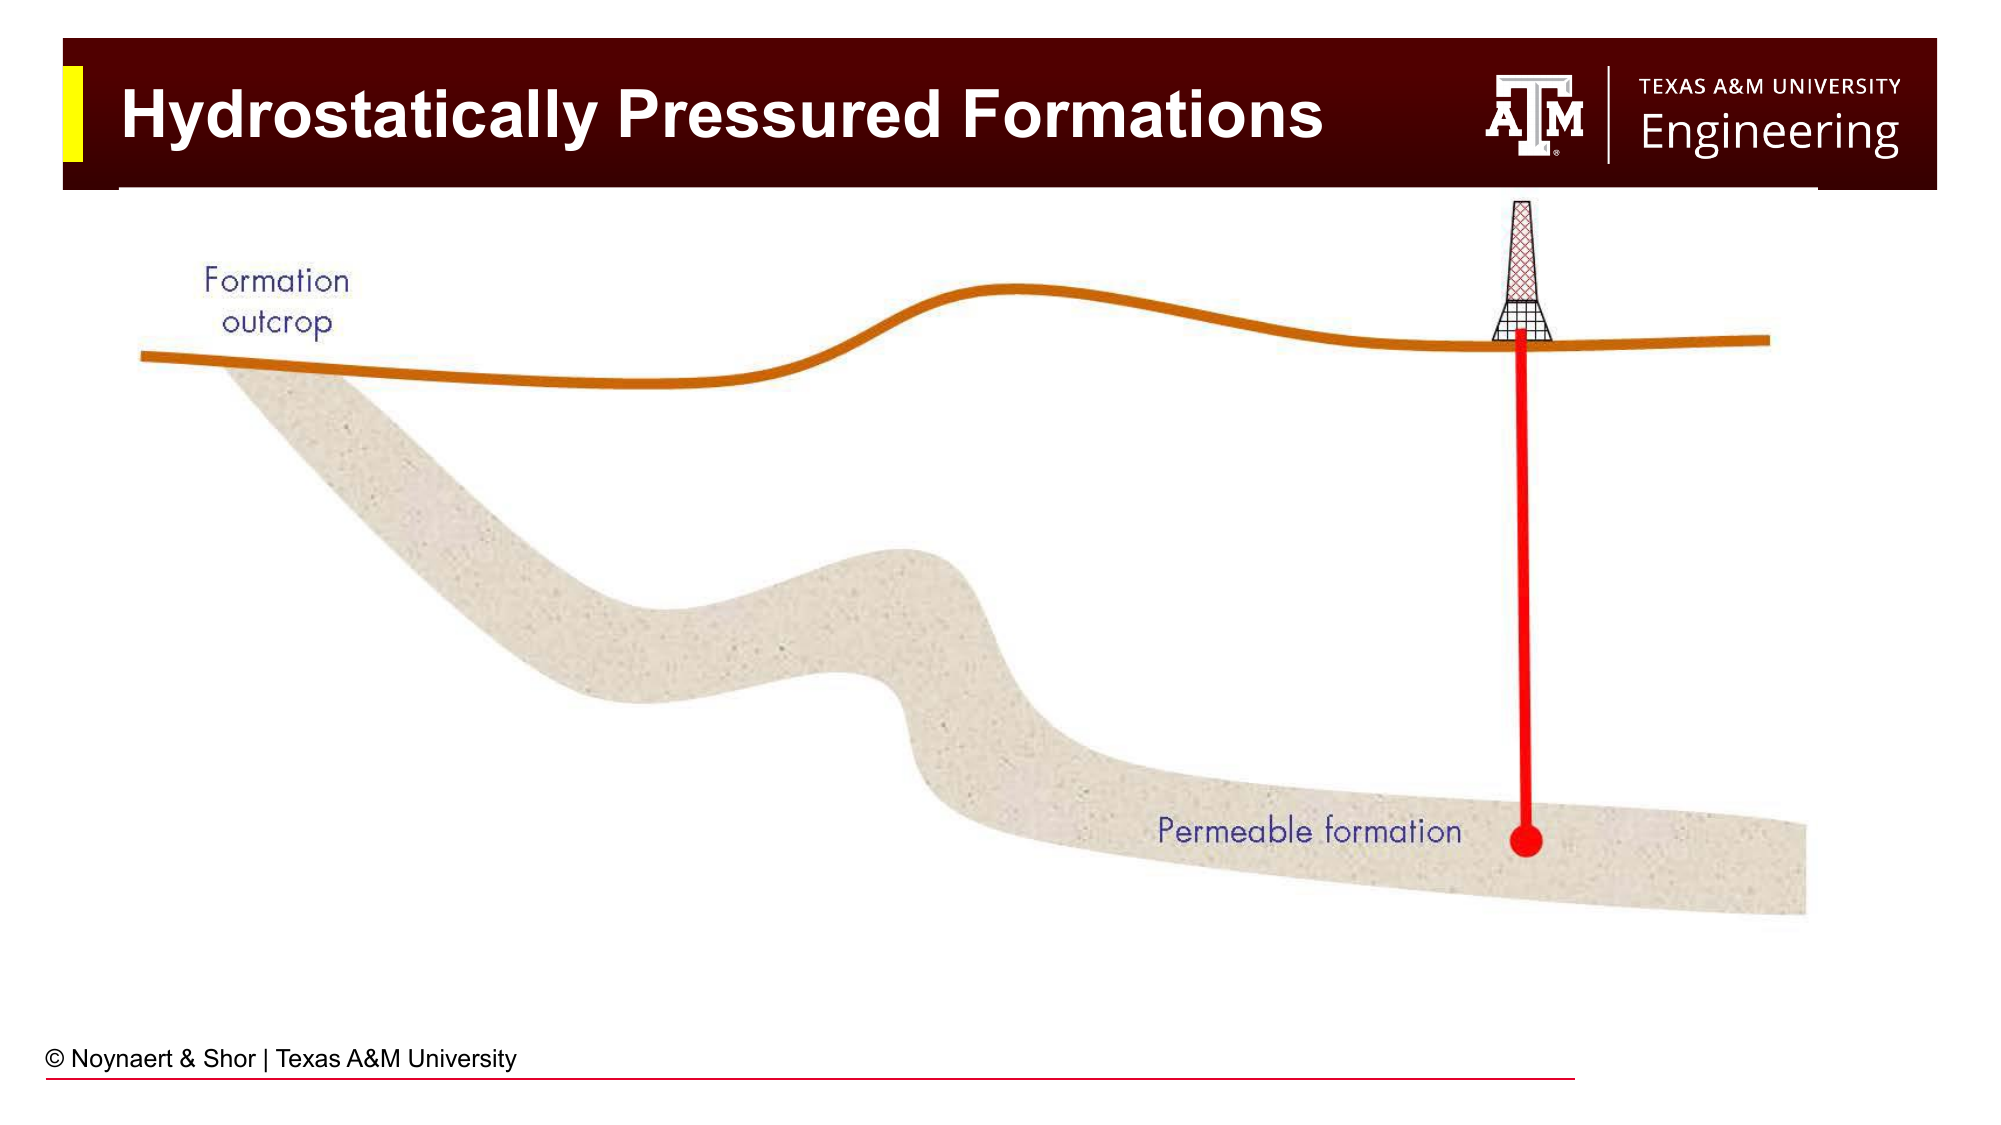
Fig. 106 In a normally pressured formation, the pore pressure equals the weight of a continuous fresh- or saltwater column from surface to the formation depth. The pressure gradient corresponds to the density of the formation water.#
Normal pressure gradient ≈ 0.433–0.465 psi/ft (fresh water to light brine).
8.3.3 Sub-normally Pressured Formations#
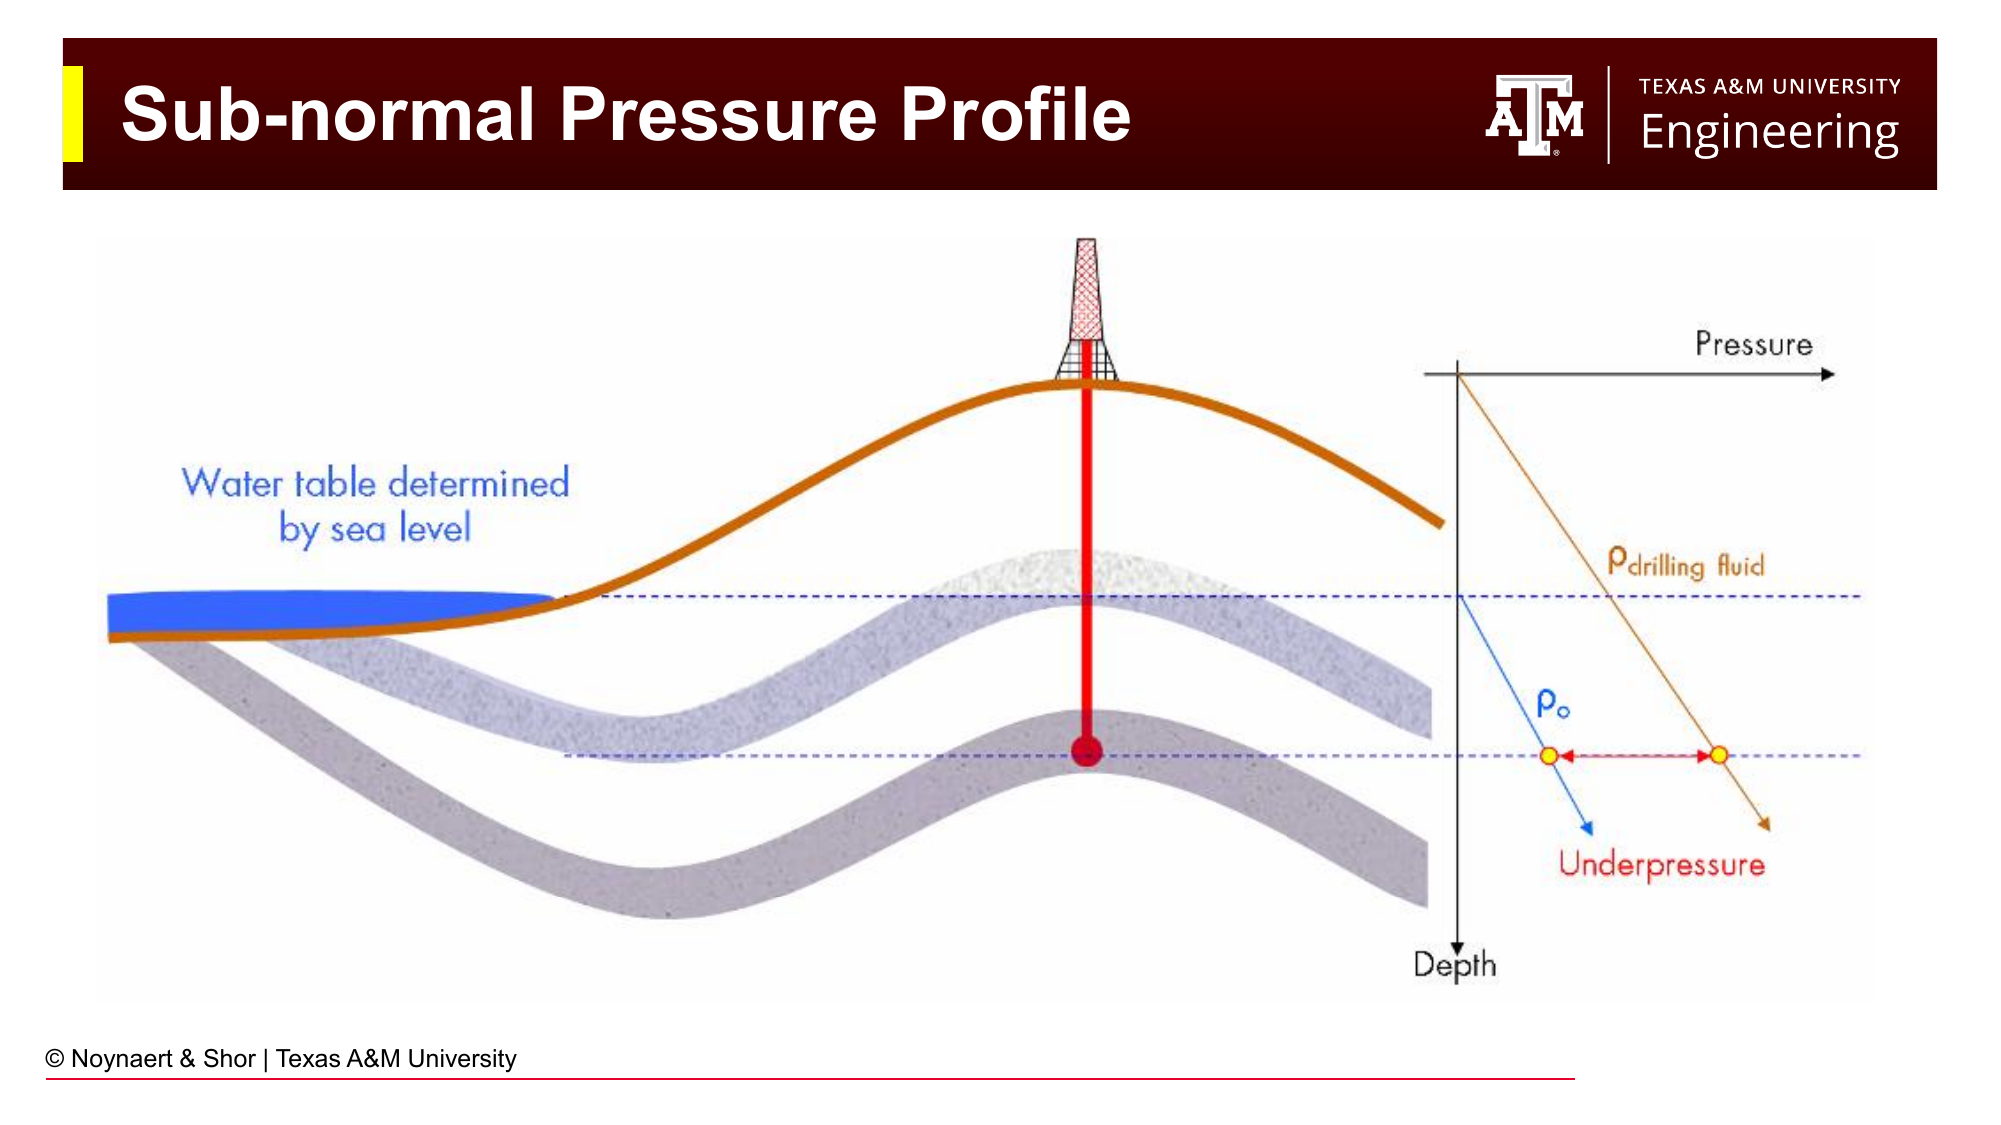
Fig. 107 Sub-normally pressured (depleted or sub-hydrostatic) formations occur when the effective hydraulic connection is to a water table at a lower elevation, or when the original pore fluid has been partly produced. The pore pressure gradient is below that of fresh water.#
Sub-normal pressure occurs when the formation pore pressure is less than the normal hydrostatic gradient. This can happen when:
The formation is connected to a water table significantly below the rig elevation (e.g., drilling on a hilltop or mountain)
The original formation fluid has been produced (depleted zones), leaving reduced pressure
Over geological time, the formation has been buried without repressurization
From a well control standpoint, sub-normally pressured formations create a lost circulation risk: the mud pressure can easily exceed the formation pressure, driving mud into the rock. Very light mud (or even drilling with air) is needed to drill these zones.
8.3.4 Over-pressured Formations#
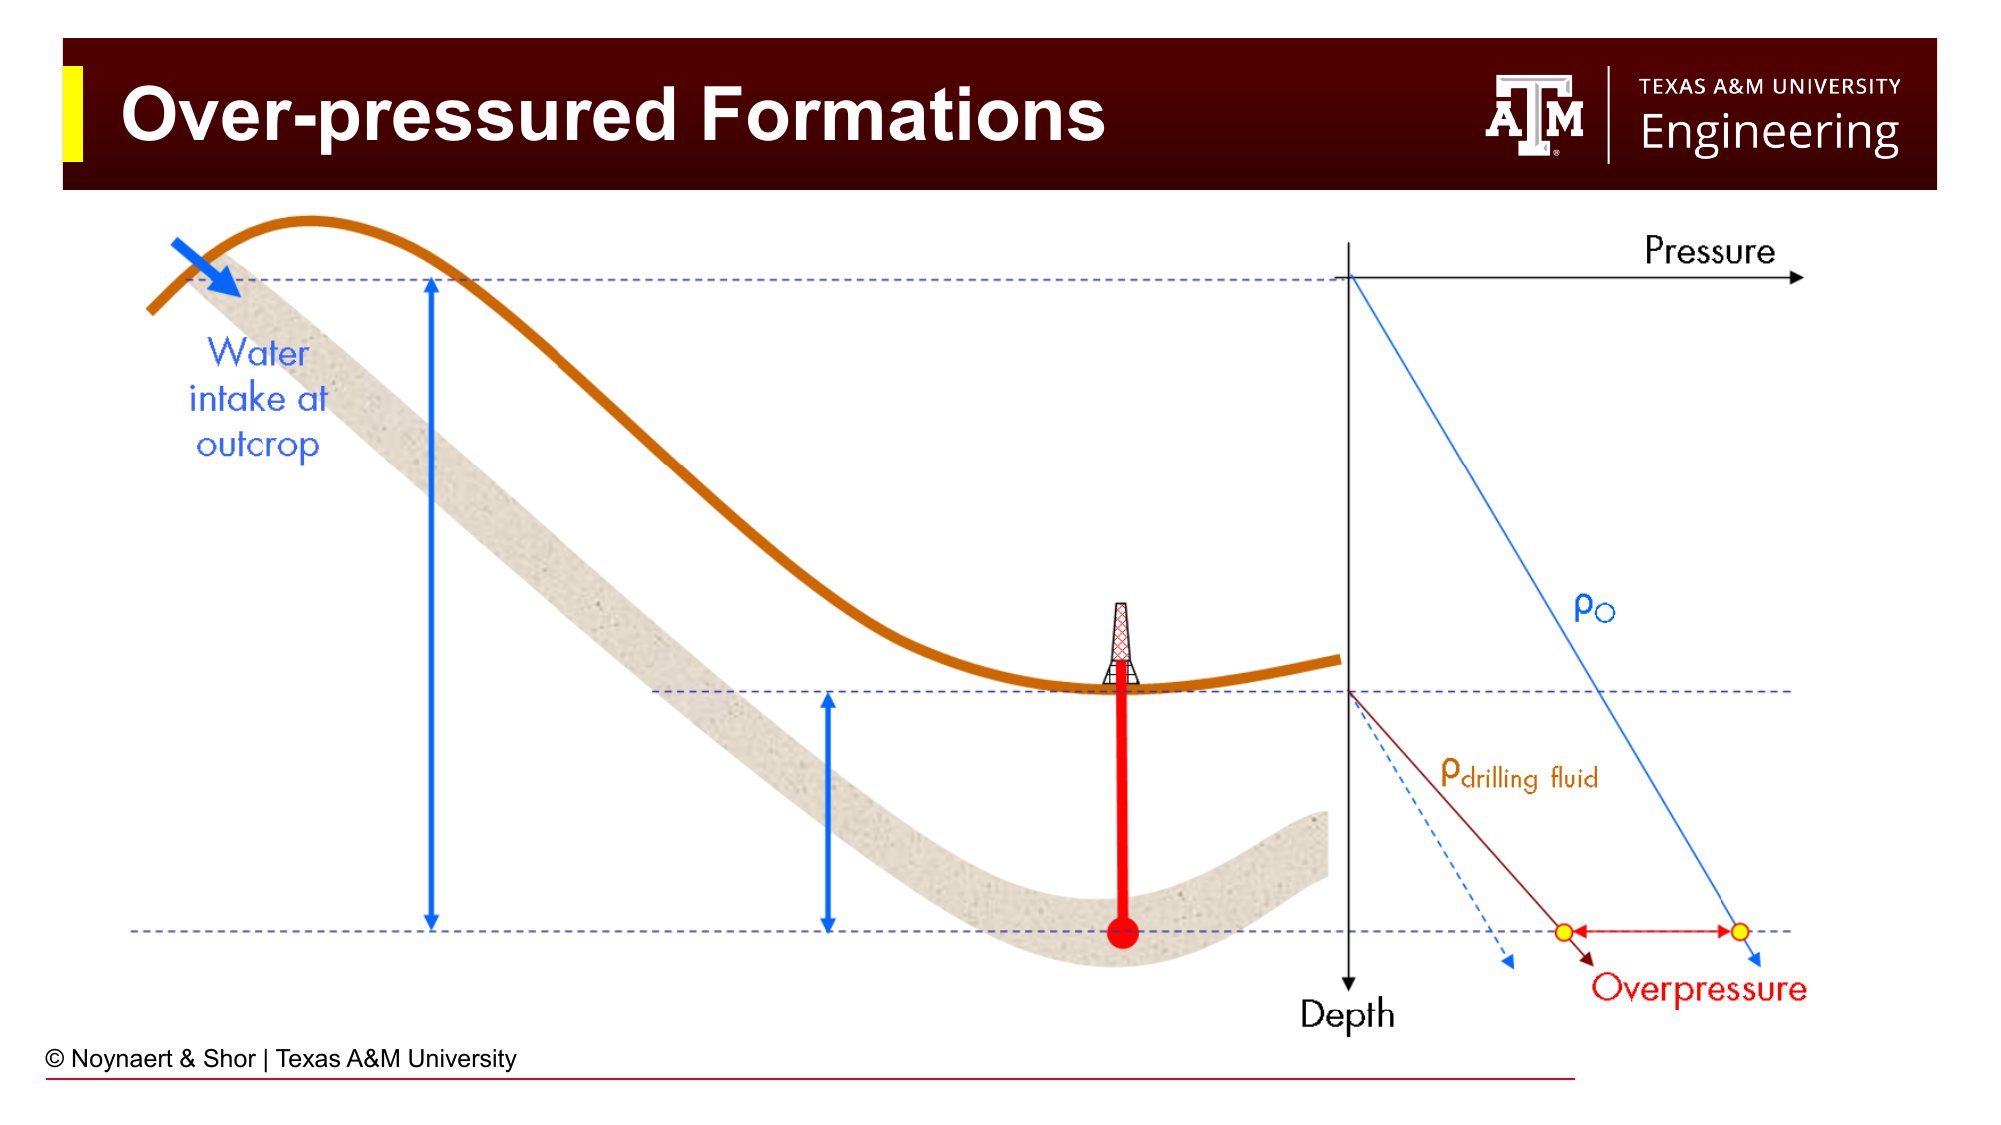
Fig. 108 Over-pressured formations arise when pore pressure exceeds the normal hydrostatic gradient. Common mechanisms include sealed traps (isolated from surface drainage), rapid burial and compaction of shales, and the presence of buoyant hydrocarbons.#
Over-pressure occurs when the pore pressure exceeds the normal hydrostatic gradient. Over-pressure requires that the formation be sealed: isolated from hydraulic connection to the surface. Common mechanisms include:
Compaction disequilibrium: rapid burial of shales prevents pore fluid from escaping, leaving the pore pressure elevated above the overburden-derived compaction pressure
Fluid column buoyancy: oil or gas, being lighter than water, exerts less hydrostatic pressure per unit depth. In a sealed trap, the pressure at the top of a gas column can significantly exceed the local hydrostatic pressure
Hydrocarbon generation: maturation of organic material generates additional fluid volume in a sealed rock, increasing pore pressure
Tectonic effects: fault movements or salt intrusions can create sealed, pressurized zones
8.3.5 The Gas Effect#
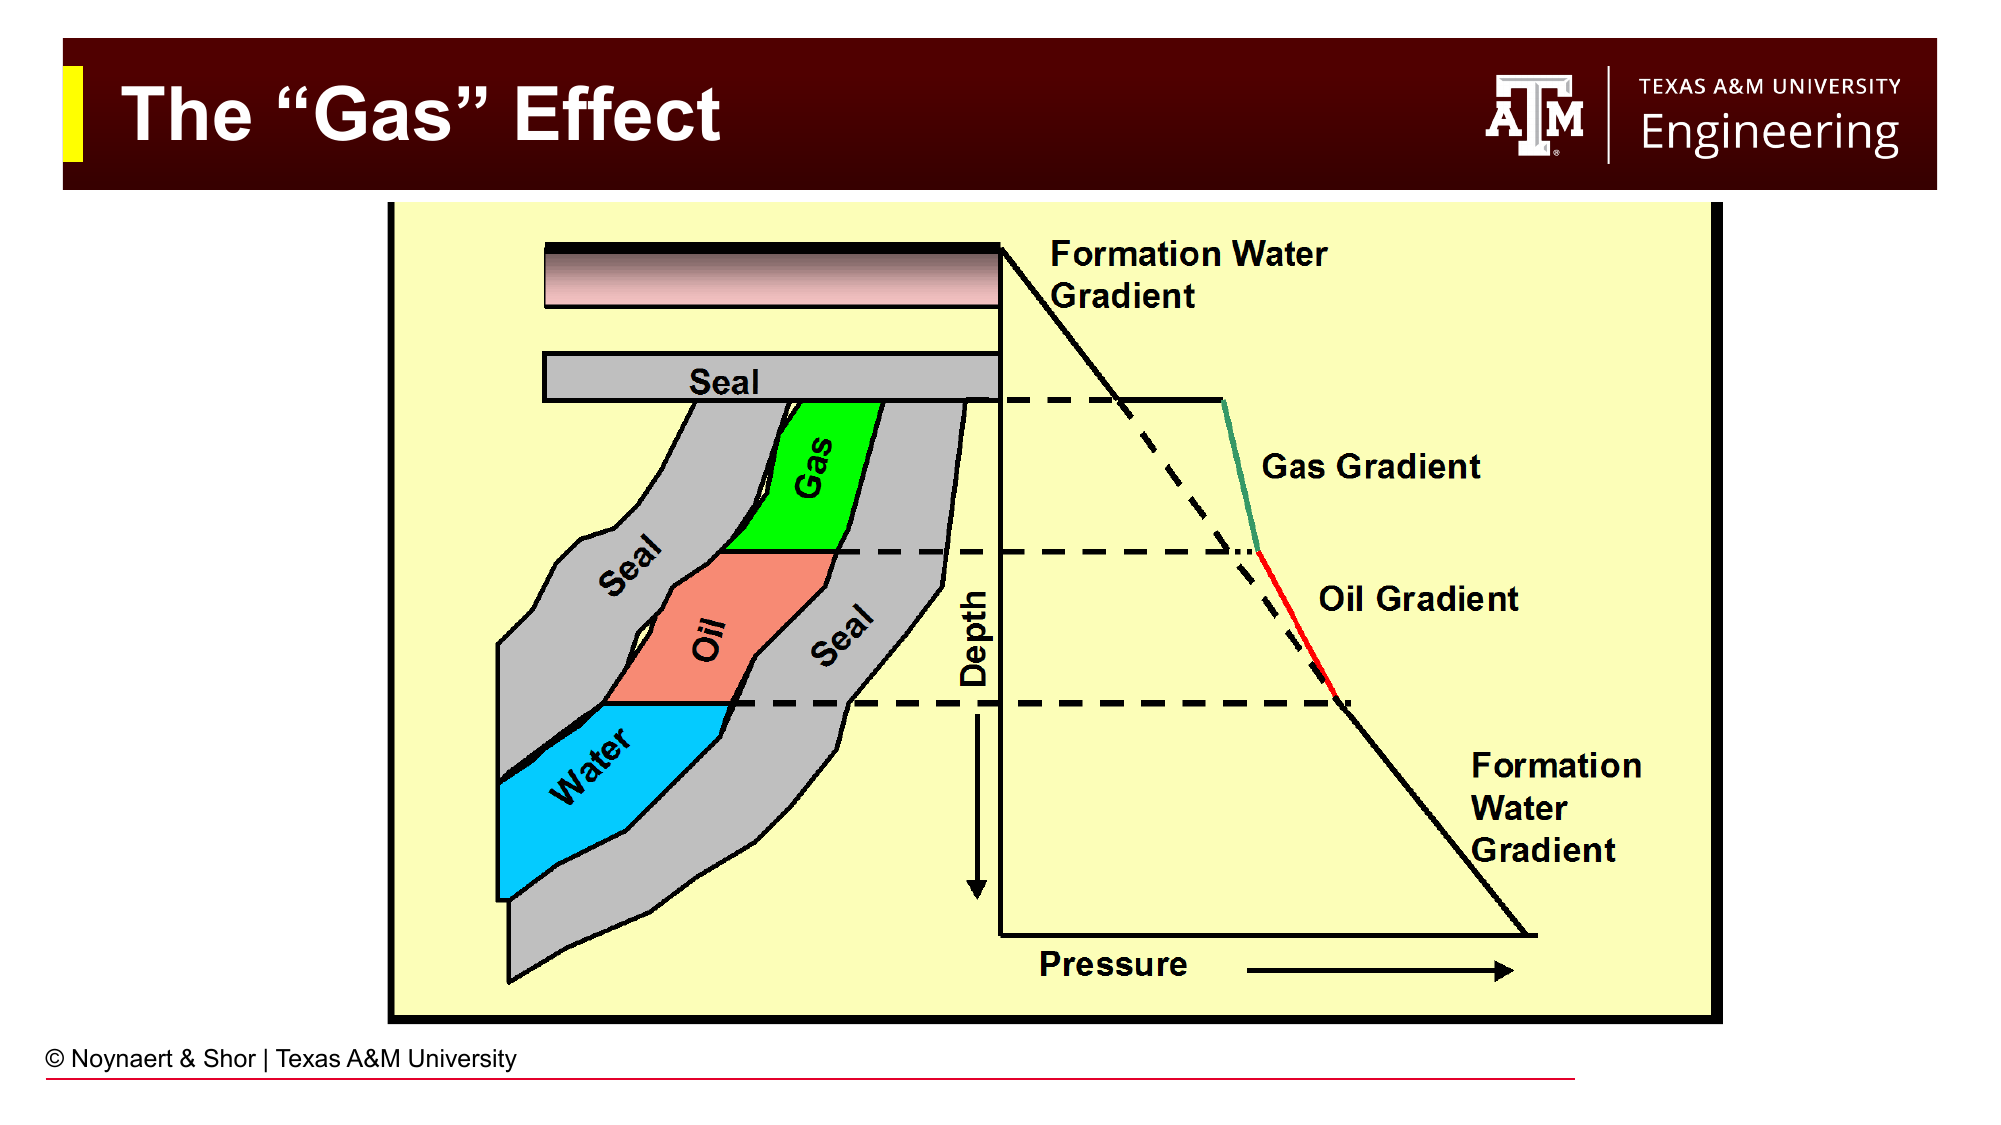
Fig. 109 The gas effect in a sealed trap. Gas, being much less dense than water, exerts a steeply sloped (low gradient) pressure profile. At the top of the gas column, the pressure is much higher than the surrounding water gradient would predict. Drilling into this zone with a water-density mud will result in an immediate kick.#
The gas effect is the most dramatic expression of over-pressure, and the most dangerous from a well control perspective. In a hydrocarbon trap, gas and oil separate from water by buoyancy. Gas, being much lighter than water (gradient ~0.065–0.1 psi/ft vs. 0.433 psi/ft for water), exerts a very shallow pressure gradient. At the water–gas contact at the bottom of the trap, the pressure equals the local water gradient pressure. Moving upward through the gas, the pressure decreases only slightly. At the top of the gas column, the pressure can be orders of magnitude higher than the local water gradient would predict at that depth.
When the drill bit penetrates a gas-bearing formation sealed by an impermeable cap rock:
The pressure in the formation at the bit face is much higher than expected
If the mud weight was designed for normally pressured rock above the cap, it will be immediately underbalanced upon entering the gas zone
Gas begins flowing into the wellbore
This is why pre-drill pore pressure prediction (from seismic data, nearby well logs, and basin models) is critical, and why the drilling program specifies when to adjust mud weight before reaching known pressure anomalies.
8.3.6 Depleted Zones#
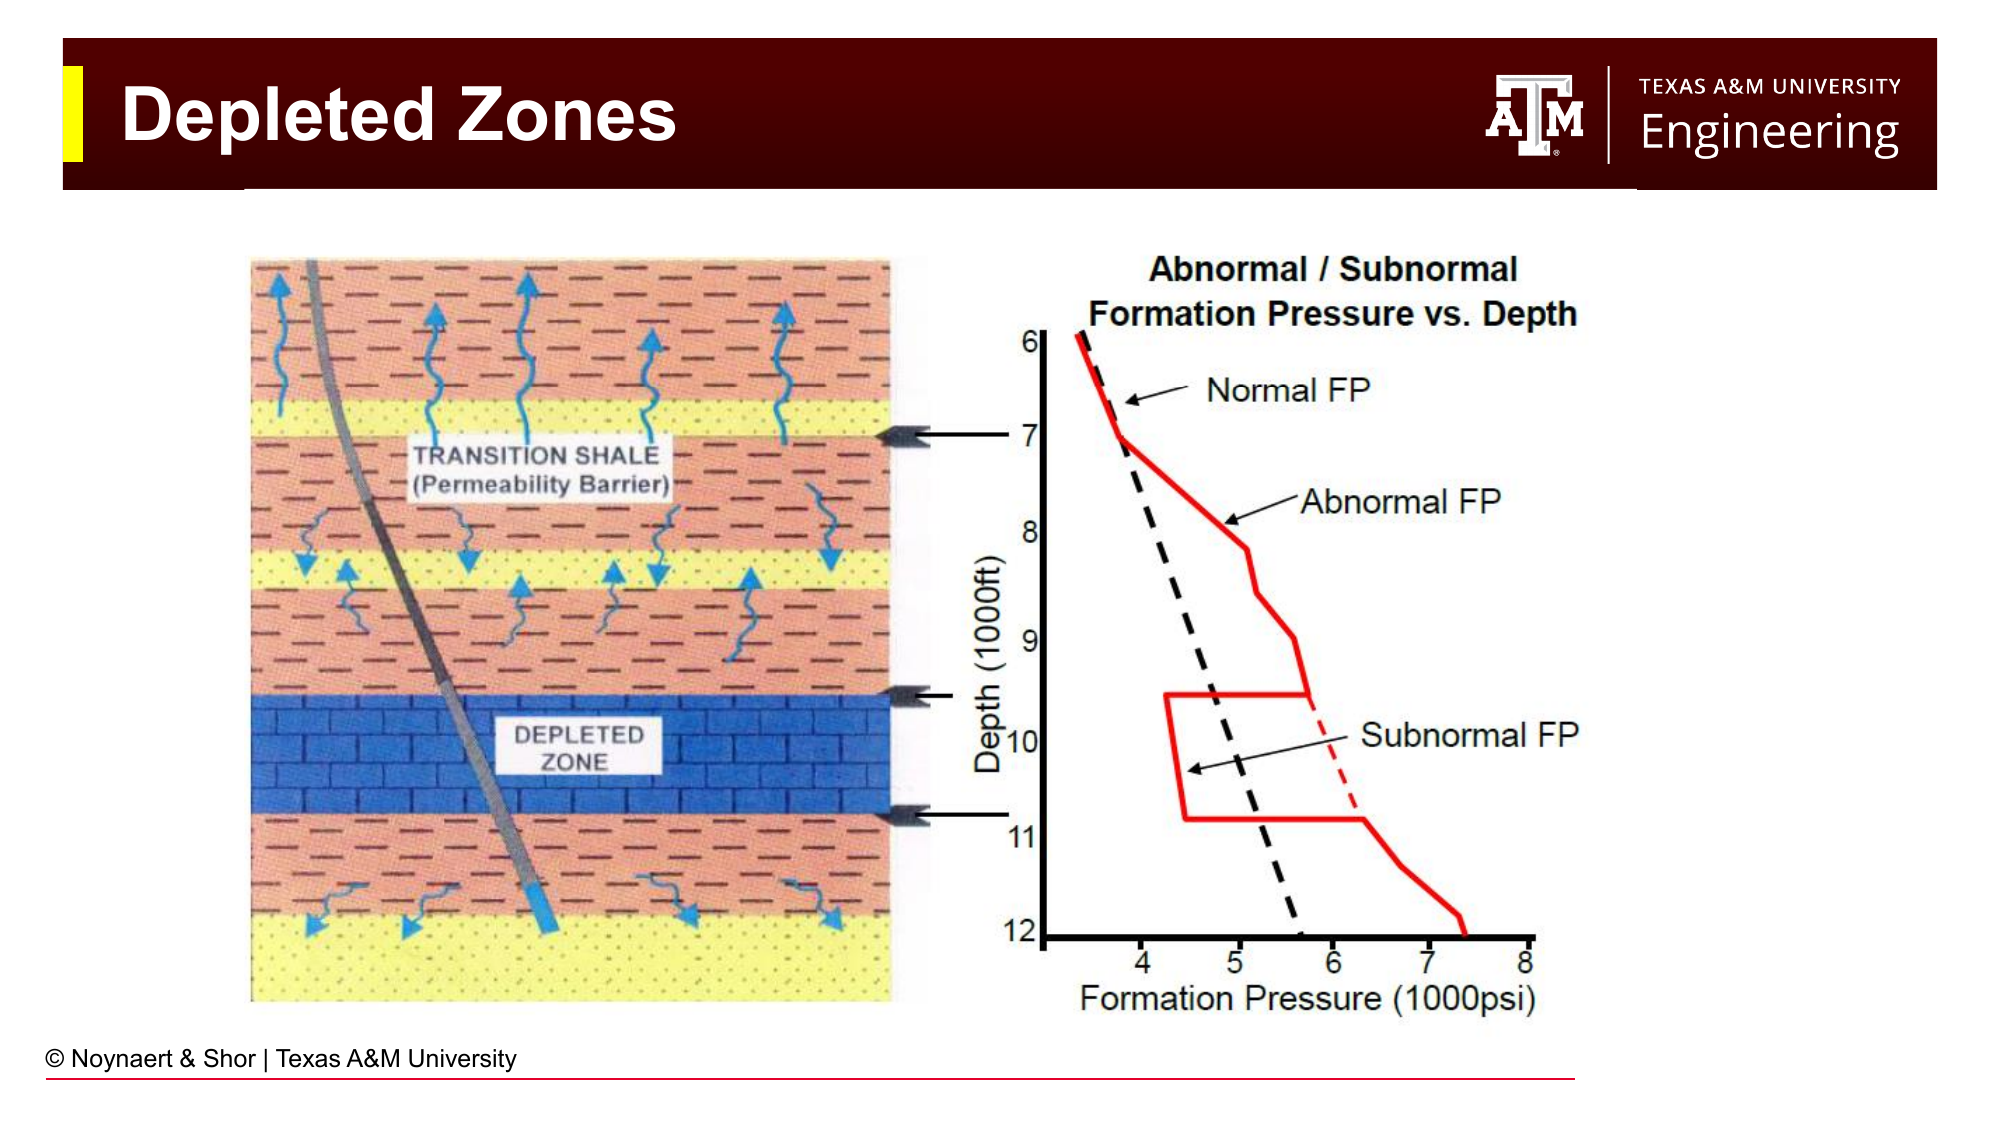
Fig. 110 A depleted zone — one from which hydrocarbons or water have already been produced — has a reduced pore pressure. Drilling through a depleted zone with standard mud weight risks driving mud into the formation (lost circulation). Filter cake formation and low-solids muds help mitigate this risk.#
Depletion occurs when production from a reservoir has reduced the pore pressure below its original value. Drilling through a depleted zone with standard mud weight can result in drilling with losses, where the mud pressure exceeds the now-reduced pore pressure, and mud flows into the formation rather than the reverse. The filter cake (discussed in Chapter 4) seals permeable formations and limits losses, but in severely depleted zones, losses can be total.
The coexistence of a normally pressured or over-pressured zone and a depleted zone in the same open-hole section is one of the most challenging well control scenarios: the mud weight needed to prevent a kick from the high-pressure zone may also cause losses in the depleted zone. This is often managed by setting casing to isolate the depleted zone before drilling into the high-pressure target, or through the use of lost circulation material (LCM), additives are usually fibrous and can clog pore throats.
8.3.7 Pore Pressure Gradients in Practice#
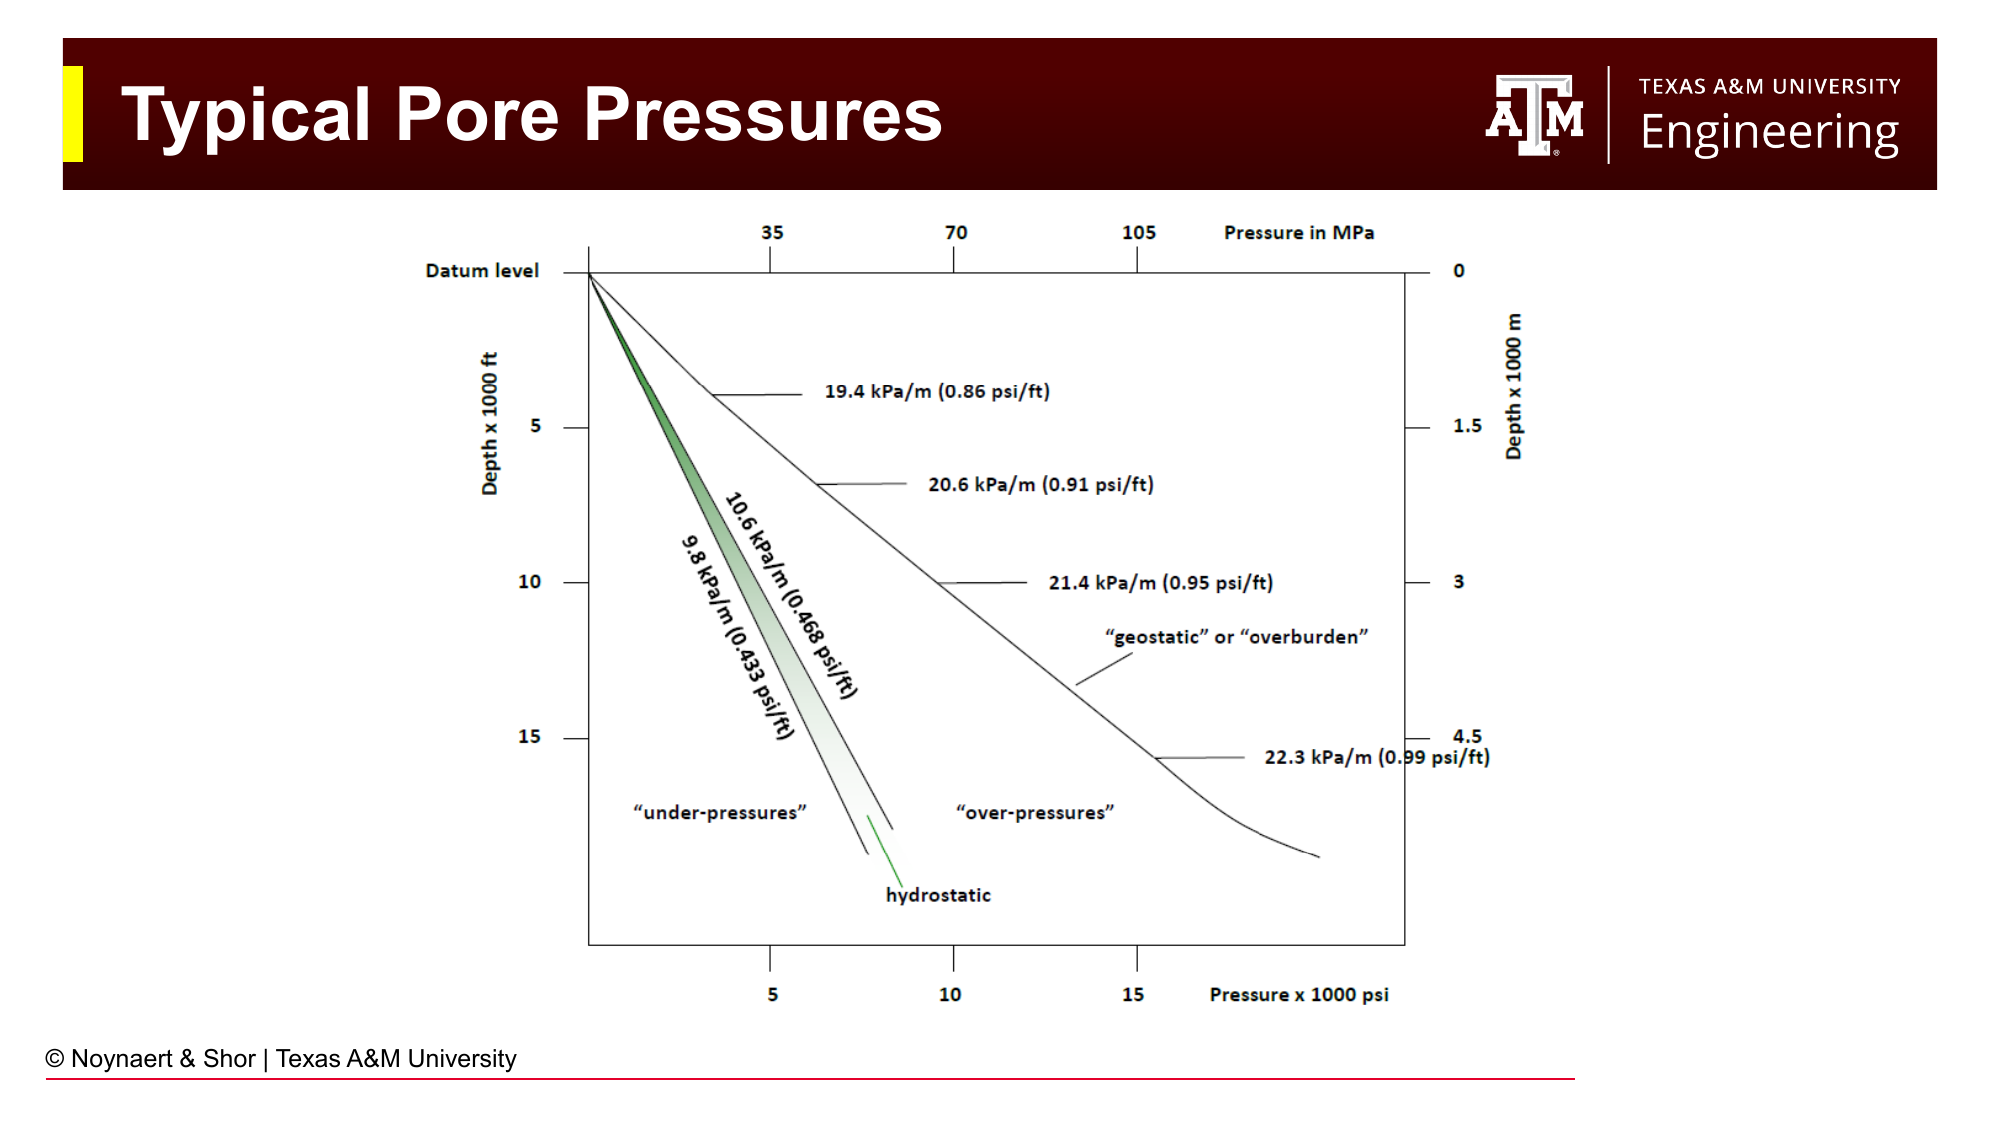
Fig. 111 Typical range of pore pressure and overburden gradients encountered in oilfield drilling. Normal pore pressures cluster around 0.433–0.465 psi/ft; overburden (rock weight) is typically 0.9–1.0 psi/ft. Severely over-pressured formations can approach the overburden gradient.#
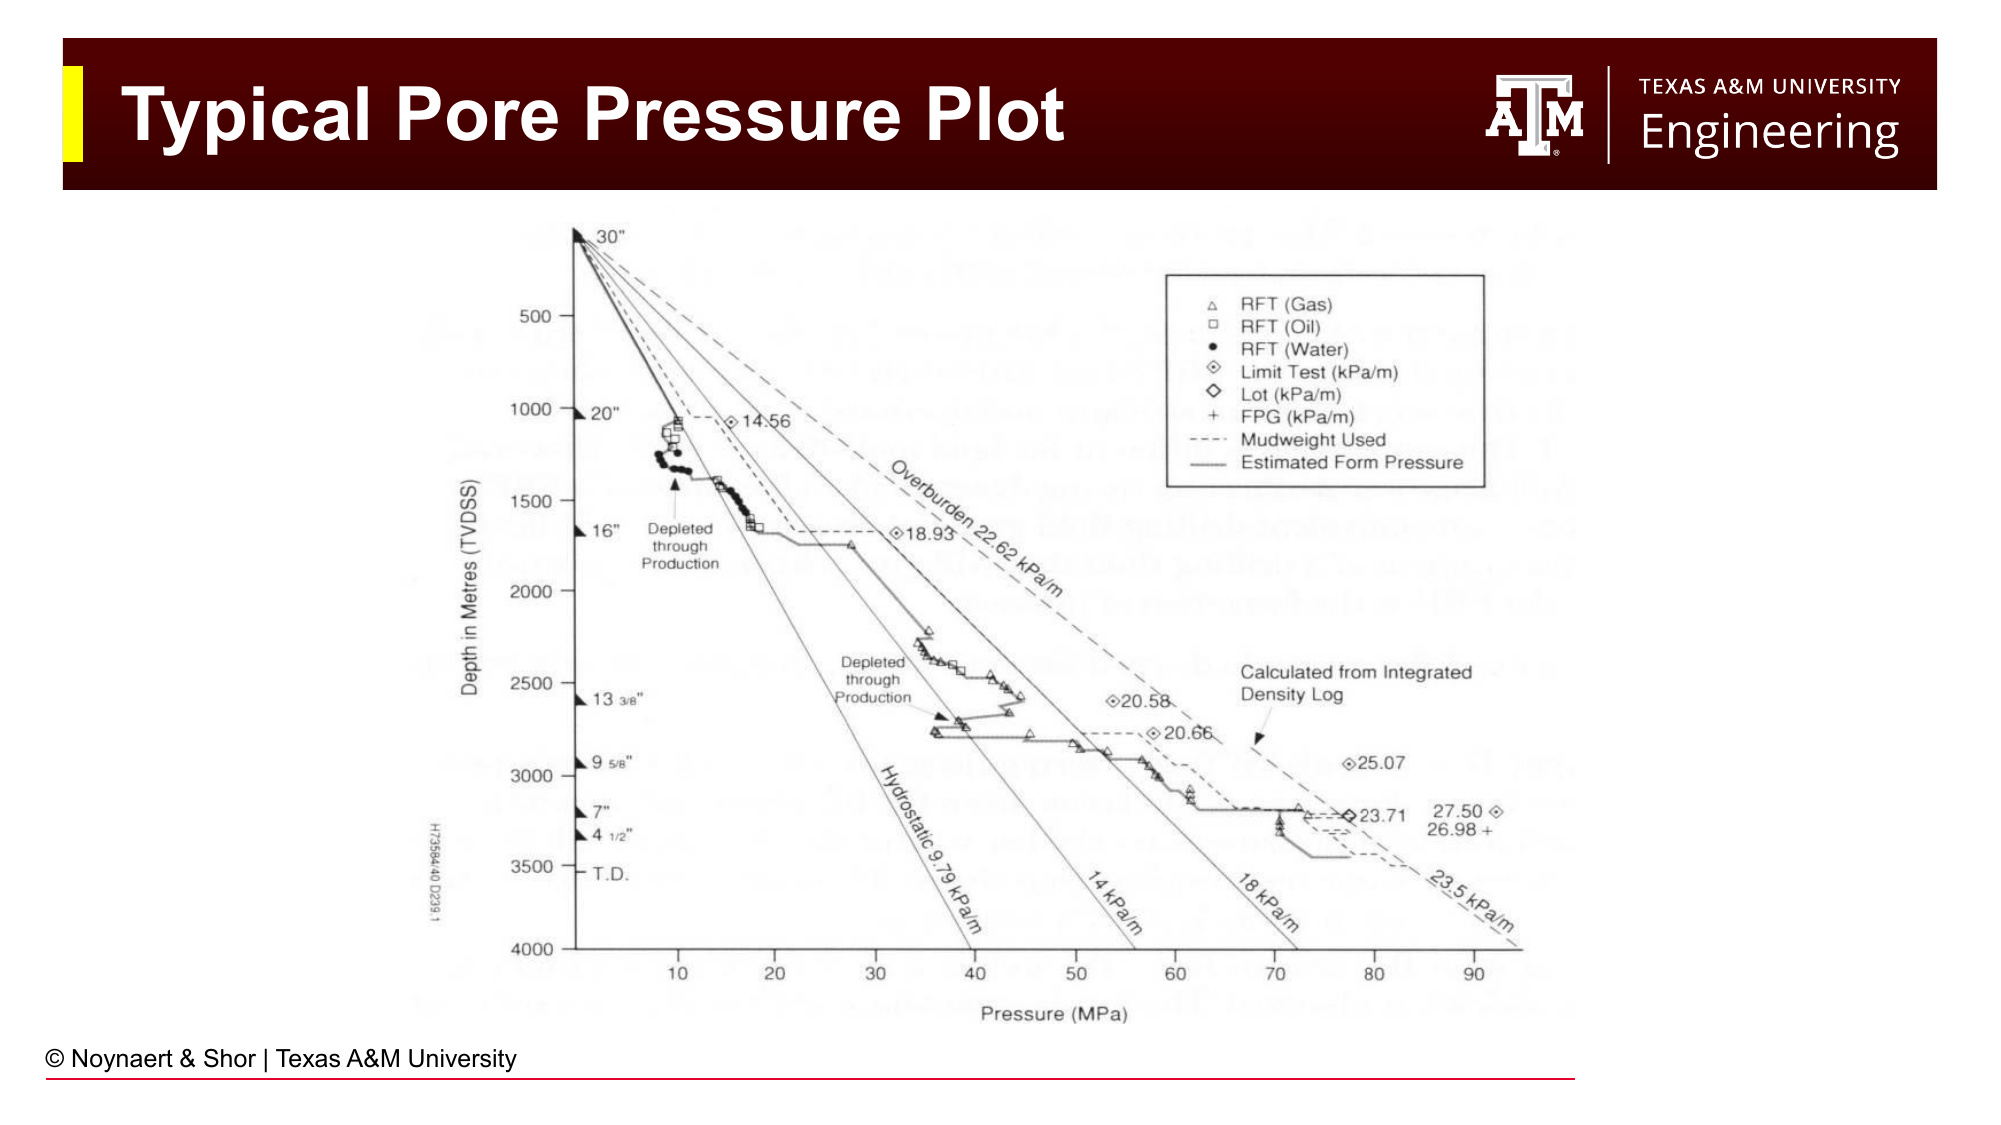
Fig. 112 A typical pore pressure plot for a Gulf of Mexico deepwater well. The shallow section is normally pressured (connected to the ocean floor). Below the first pressure seal (shale cap), pore pressure increases. Below the second seal, the gas effect creates a steeply over-pressured zone. These transitions drive the casing program design.#
The figure above illustrates a real pore pressure profile from a deepwater Gulf of Mexico well. Key observations:
Shallow section: normally pressured (connected through permeable shallow sediments to the ocean floor)
First transition: encountering a regional shale seal; pore pressure begins to increase above hydrostatic
Second transition: entering the gas-bearing reservoir section; pore pressure increases sharply due to the gas effect (pressure at the top of the gas column is nearly twice the hydrostatic gradient at that depth)
The casing program is designed to set shoes wherever the pore pressure exceeds the fracture gradient achievable with the previous casing string, or wherever a formation pressure seal is anticipated.
8.4 Primary Well Control#
8.4.1 Overbalance: The Goal of Primary Well Control#
Fig. 113 Primary well control relies on the hydrostatic pressure of the mud column to overbalance pore pressure at all open formations. The filter cake provides secondary sealing to prevent steady-state fluid loss even when the overbalance is modest.#
Primary well control is maintained as long as:
at every open formation. The difference \((P_{hydrostatic} - P_{pore})\) is called the overbalance. When positive, formation fluid cannot enter the wellbore against the hydrostatic head of mud.
In practice, a small positive overbalance (typically 50–300 psi, or 0.1–0.5 ppg EMW) is maintained as a safety margin. Larger overbalance is generally undesirable because it slows drilling and increases the risk of fracturing the formation or losing returns.
8.4.2 The Drilling Fluid Density Trade-Off#
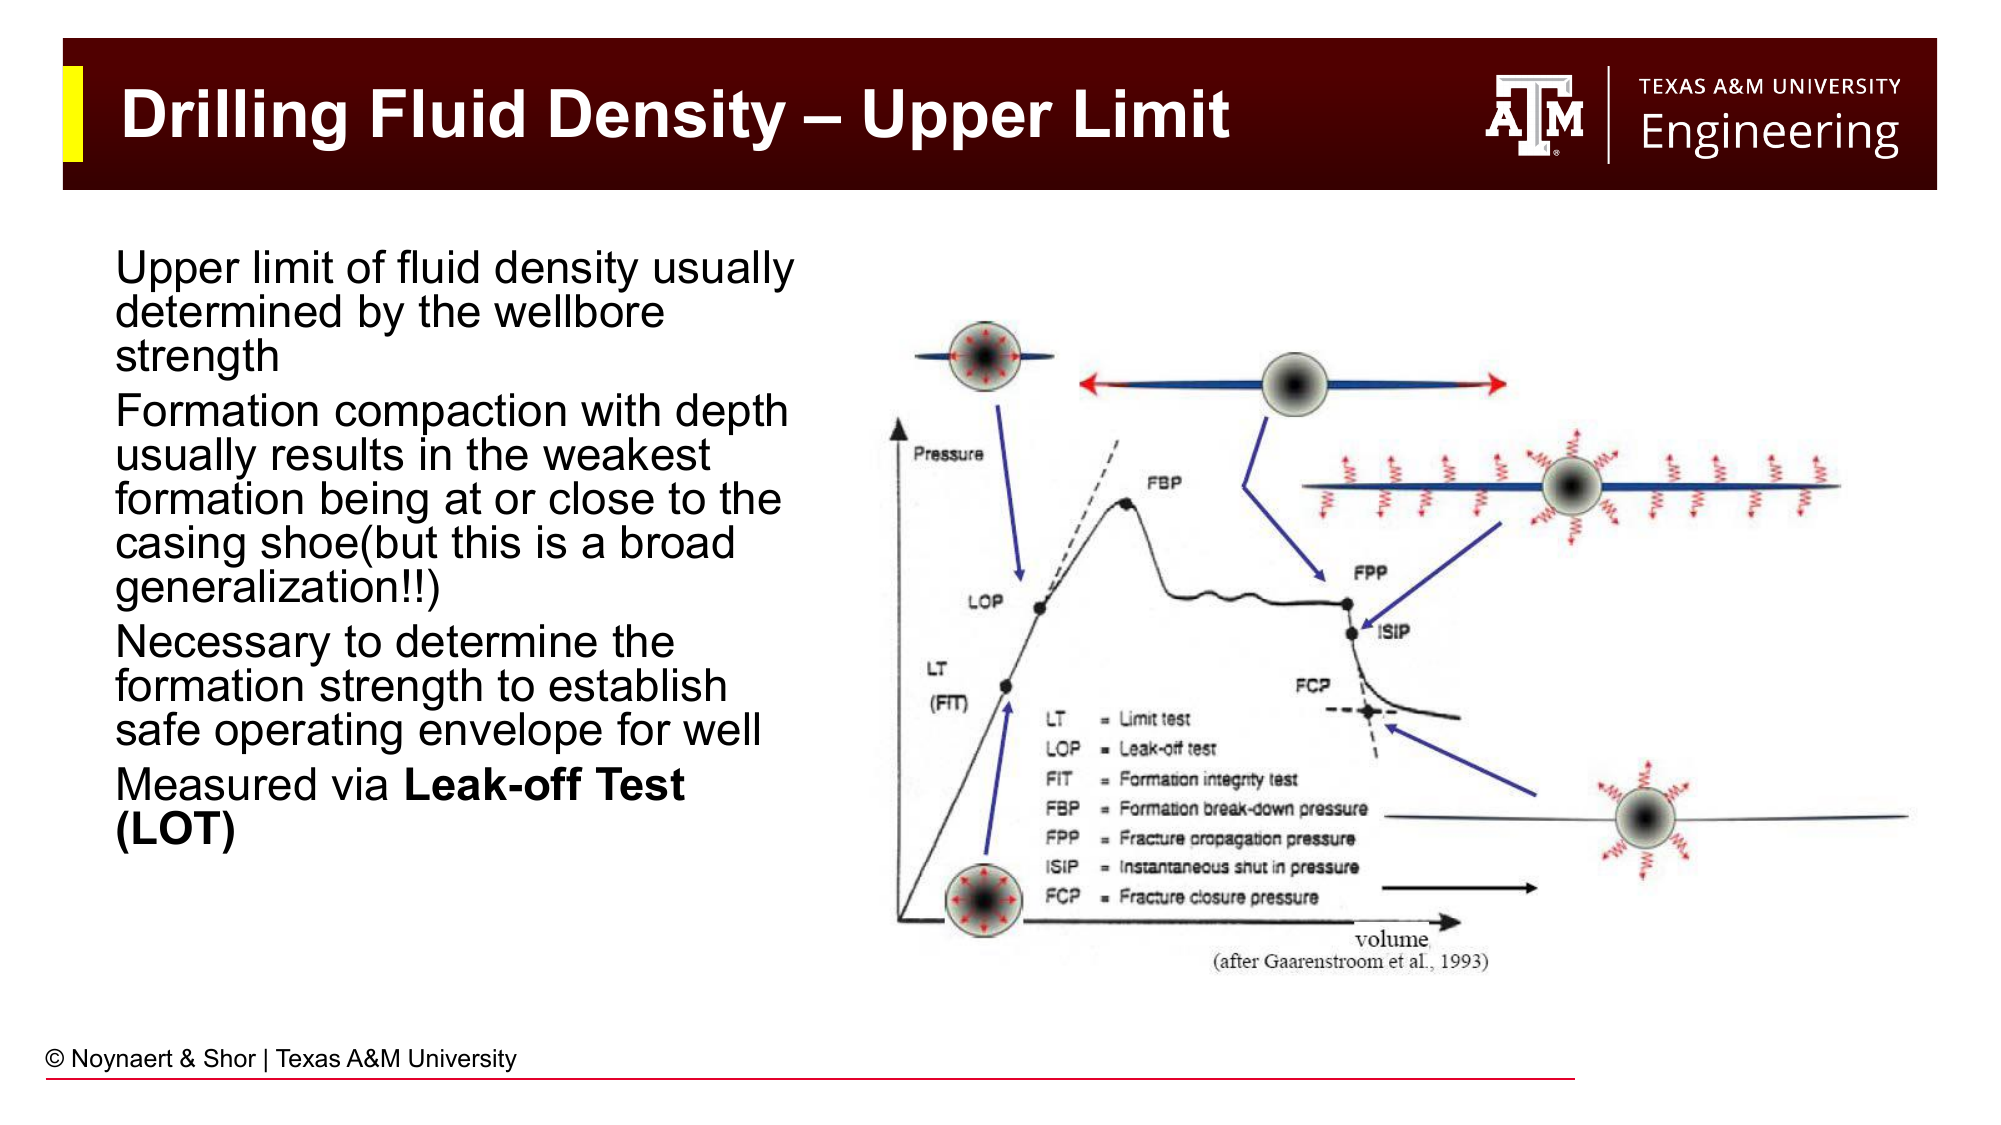
Fig. 114 Pressure vs. volume injected during a leak-off test (LOT). Below the leak-off pressure (LOP), the relationship is linear — fluid is compressing elastically. At the LOP, fluid begins entering a micro-fracture. Formation breakdown pressure (FBP) is the maximum pressure; fracture propagation pressure is the stable pressure during continued injection. The fracture closure pressure determines how much pressure can be re-applied to reopen an existing fracture.#
Drilling fluid density is a balancing act:
Too low: Bottomhole pressure falls below pore pressure → kick → potential blowout. Also, a low-density mud may not provide enough pressure to maintain wellbore stability in reactive shales.
Too high: Bottomhole pressure exceeds the fracture gradient of the weakest formation in the open hole. Fluid enters fractures → lost circulation. Severe losses can cause the hydrostatic level in the annulus to fall, paradoxically reducing bottomhole pressure and inviting a kick from a deeper zone while losing mud to a shallower zone simultaneously, a differential sticking and blowout scenario.
In addition: higher density muds increase ECD (Chapter 7), slow drilling (more pressure on the bit face retards chip removal), and are more expensive.
8.4.3 The Leak-Off Test and Formation Strength#
The leak-off test (LOT) is conducted after drilling out of a new casing shoe to determine the strength of the formation at that depth. With the bit a few feet below the shoe, the well is closed in and mud is pumped slowly. The surface pressure increases linearly as the wellbore fluid is compressed. When the pressure deviates from linearity, the formation has begun to accept fluid — this is the leak-off pressure (LOP).
Some LOTs are continued to formation breakdown — the point where the rock fractures, others are stopped at the LOP, and other are only pressured to specified design value. The choice depends on whether the operator wants to know only the formation competence at the shoe (stopped at LOP or a design pressure) or the full fracture initiation and propagation pressures. Once the shoe is fractured, it is permanently weakened.
The leak-off pressure is then converted to an equivalent mud weight at the shoe depth:
8.4.4 Maximum Allowable Annular Surface Pressure (MAASP)#
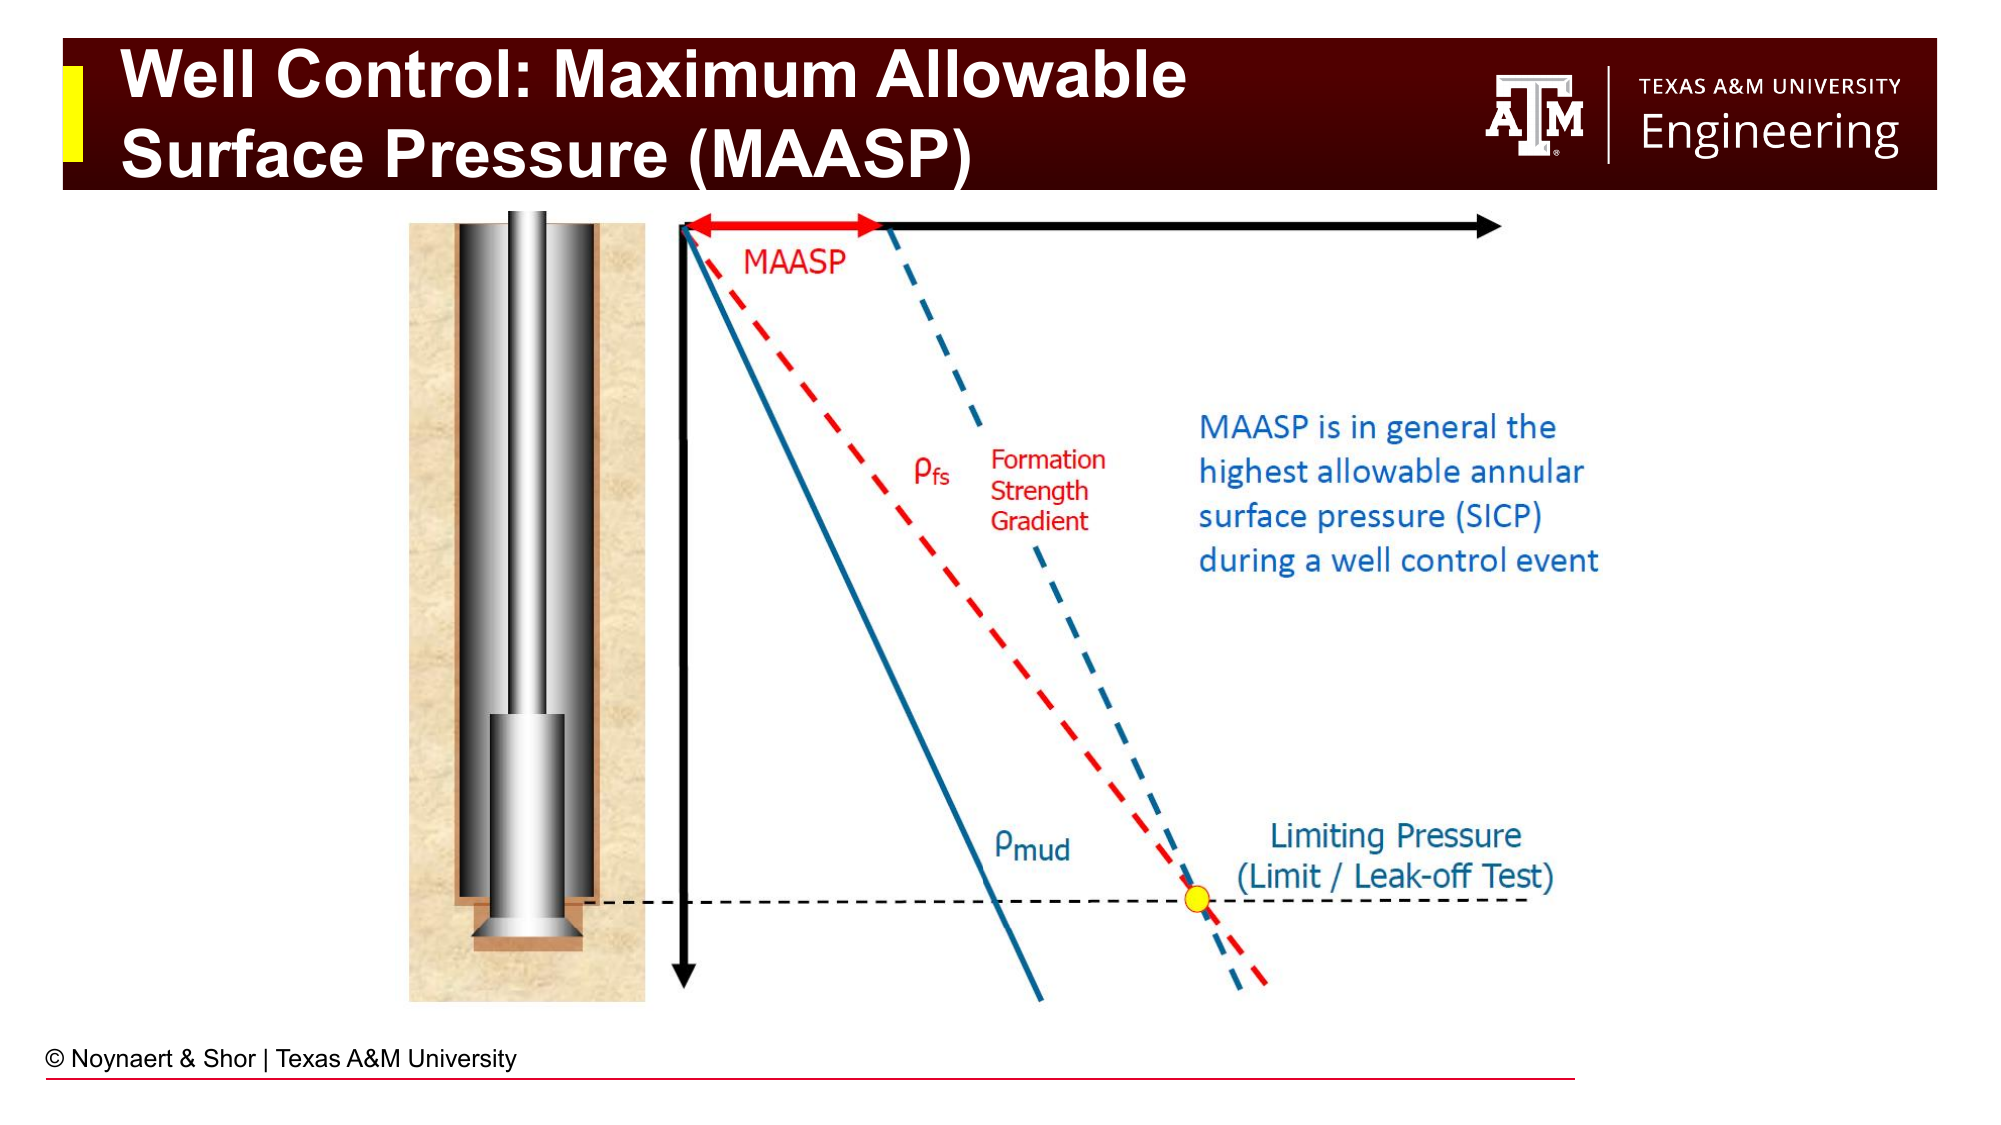
Fig. 115 MAASP limits how much pressure the BOP stack can apply to the annulus at surface during a well control operation. It is determined by the fracture pressure at the casing shoe (the weakest exposed point), minus the hydrostatic pressure of the mud column at the shoe depth.#
During a well kill operation, the BOP stack applies surface pressure to the wellbore to control the kick while heavy mud is pumped in. This surface pressure is added to the hydrostatic pressure at every point in the wellbore — including at the casing shoe, which is the weakest point (the formation directly below the shoe is exposed to the highest effective pressure within the wellbore).
The Maximum Allowable Annular Surface Pressure (MAASP) is the maximum surface pressure that can be applied to the annulus without fracturing the formation at the casing shoe:
MAASP is calculated at the beginning of each open-hole section and must be displayed clearly at the driller’s console. During a kill operation, the annular surface pressure must never exceed MAASP. If it does, there is a risk of an underground blowout occuring.
8.5 Temporary Reductions in Bottomhole Pressure#
Even with a properly designed mud weight, the bottomhole pressure can be temporarily reduced or increased by operational activities. The two primary mechanisms are swabbing (tripping out of hole) and surge (tripping into hole).
8.5.1 Swabbing#
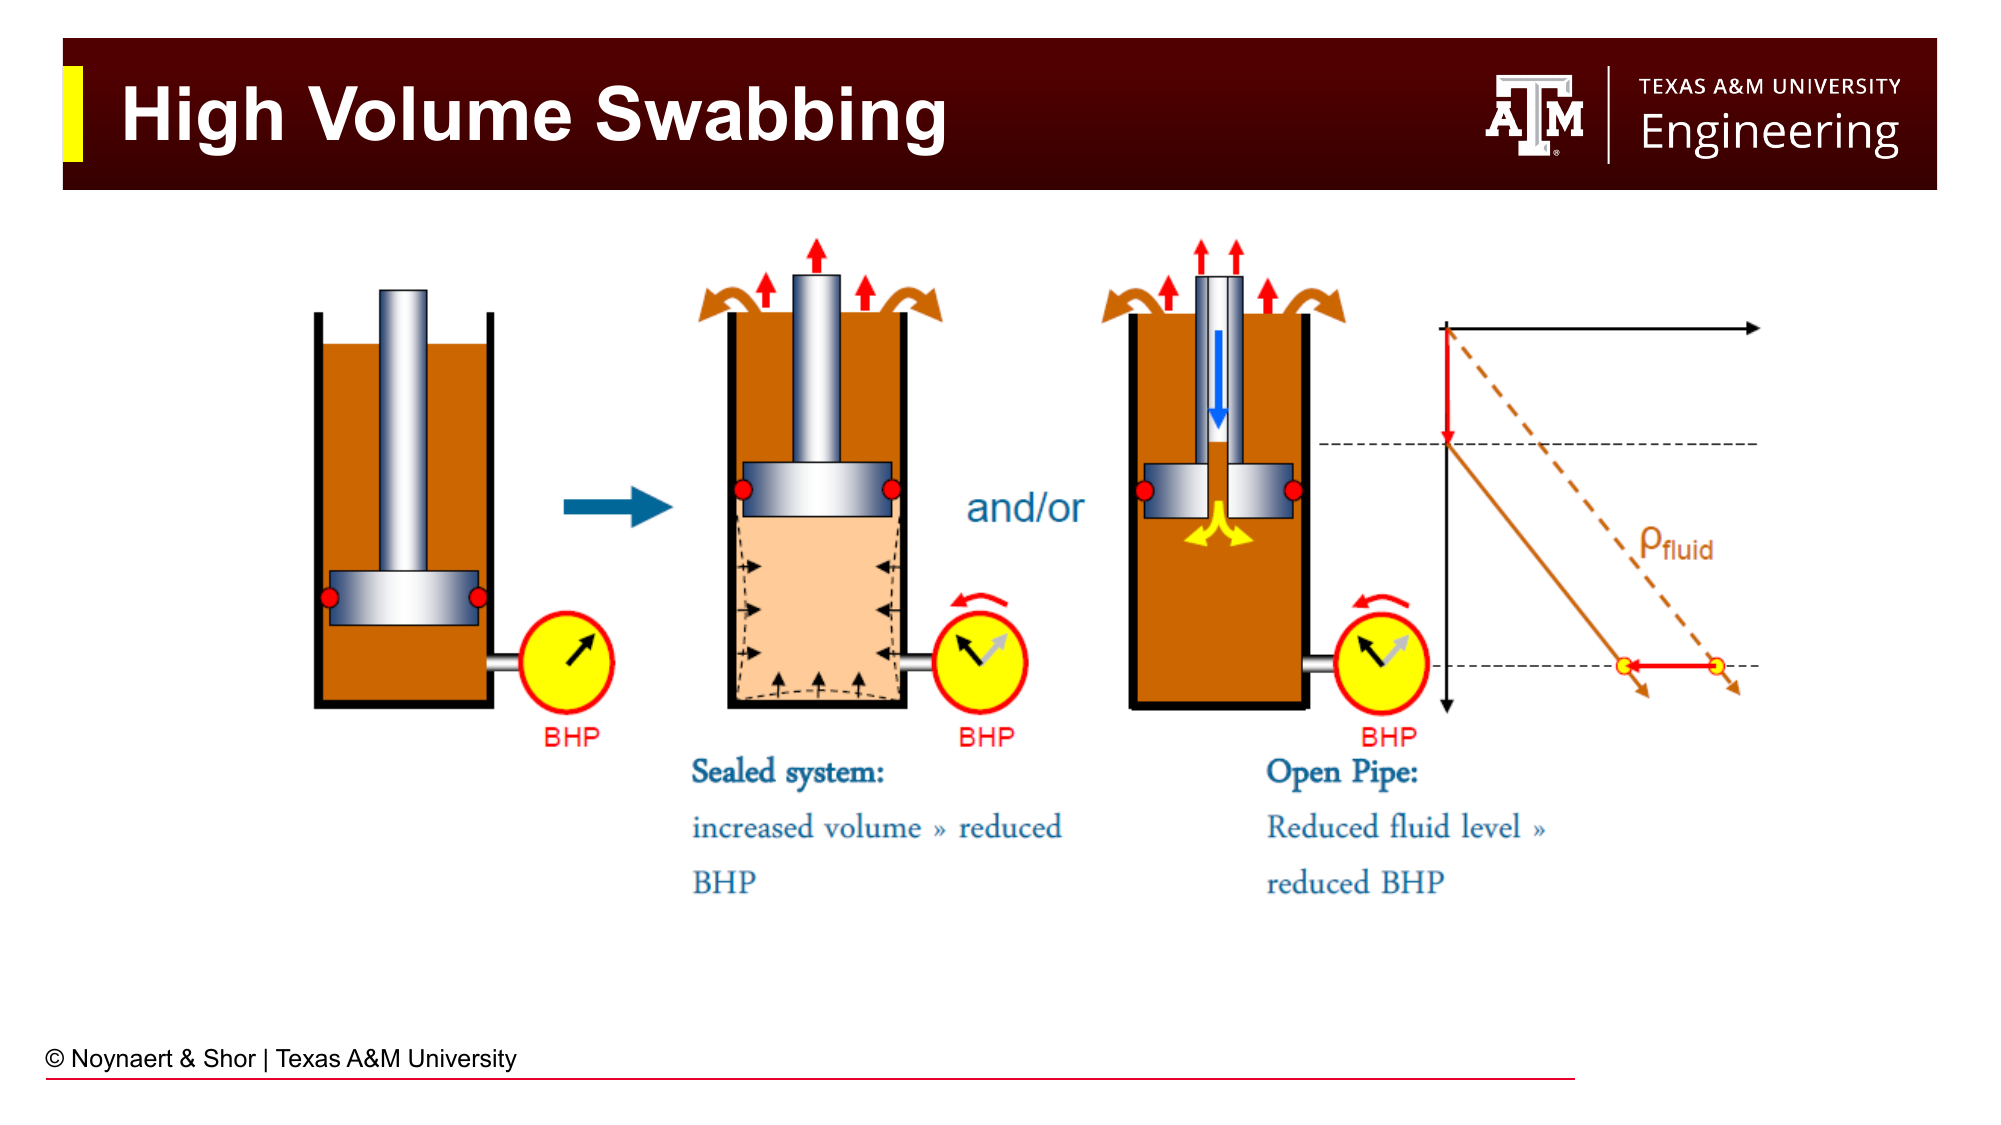
Fig. 116 High-volume swabbing occurs when a packed-off or balled-up bit acts as a piston, pulling formation fluid into the wellbore as the drill string is pulled upward. The mud level in the annulus rises as formation fluid fills the space vacated by the pulled-out drillstring rather than mud flowing down to fill it.#
Swabbing is a reduction in bottomhole pressure caused by pulling the drill string out of the hole. The drill string displaces fluid in the wellbore; when it is pulled up, that fluid must flow back downward (through the annular gap around the bit and BHA), and through the drillbit, to fill the vacated space. If this flow is restricted, by a packed-off (plugged) bit, tight BHA-to-wellbore clearances, or very viscous mud, the wellbore cannot refill fast enough, and a pressure deficit (temporary reduction in BHP) develops below the bit.
High-volume swabbing occurs when the bit is packed off with cuttings and acts essentially as a solid piston. As the drill string is pulled up, the entire volume below the bit must be filled with formation fluid because no mud can flow past the packed bit. The result can be a large, sustained inflow of formation fluid.
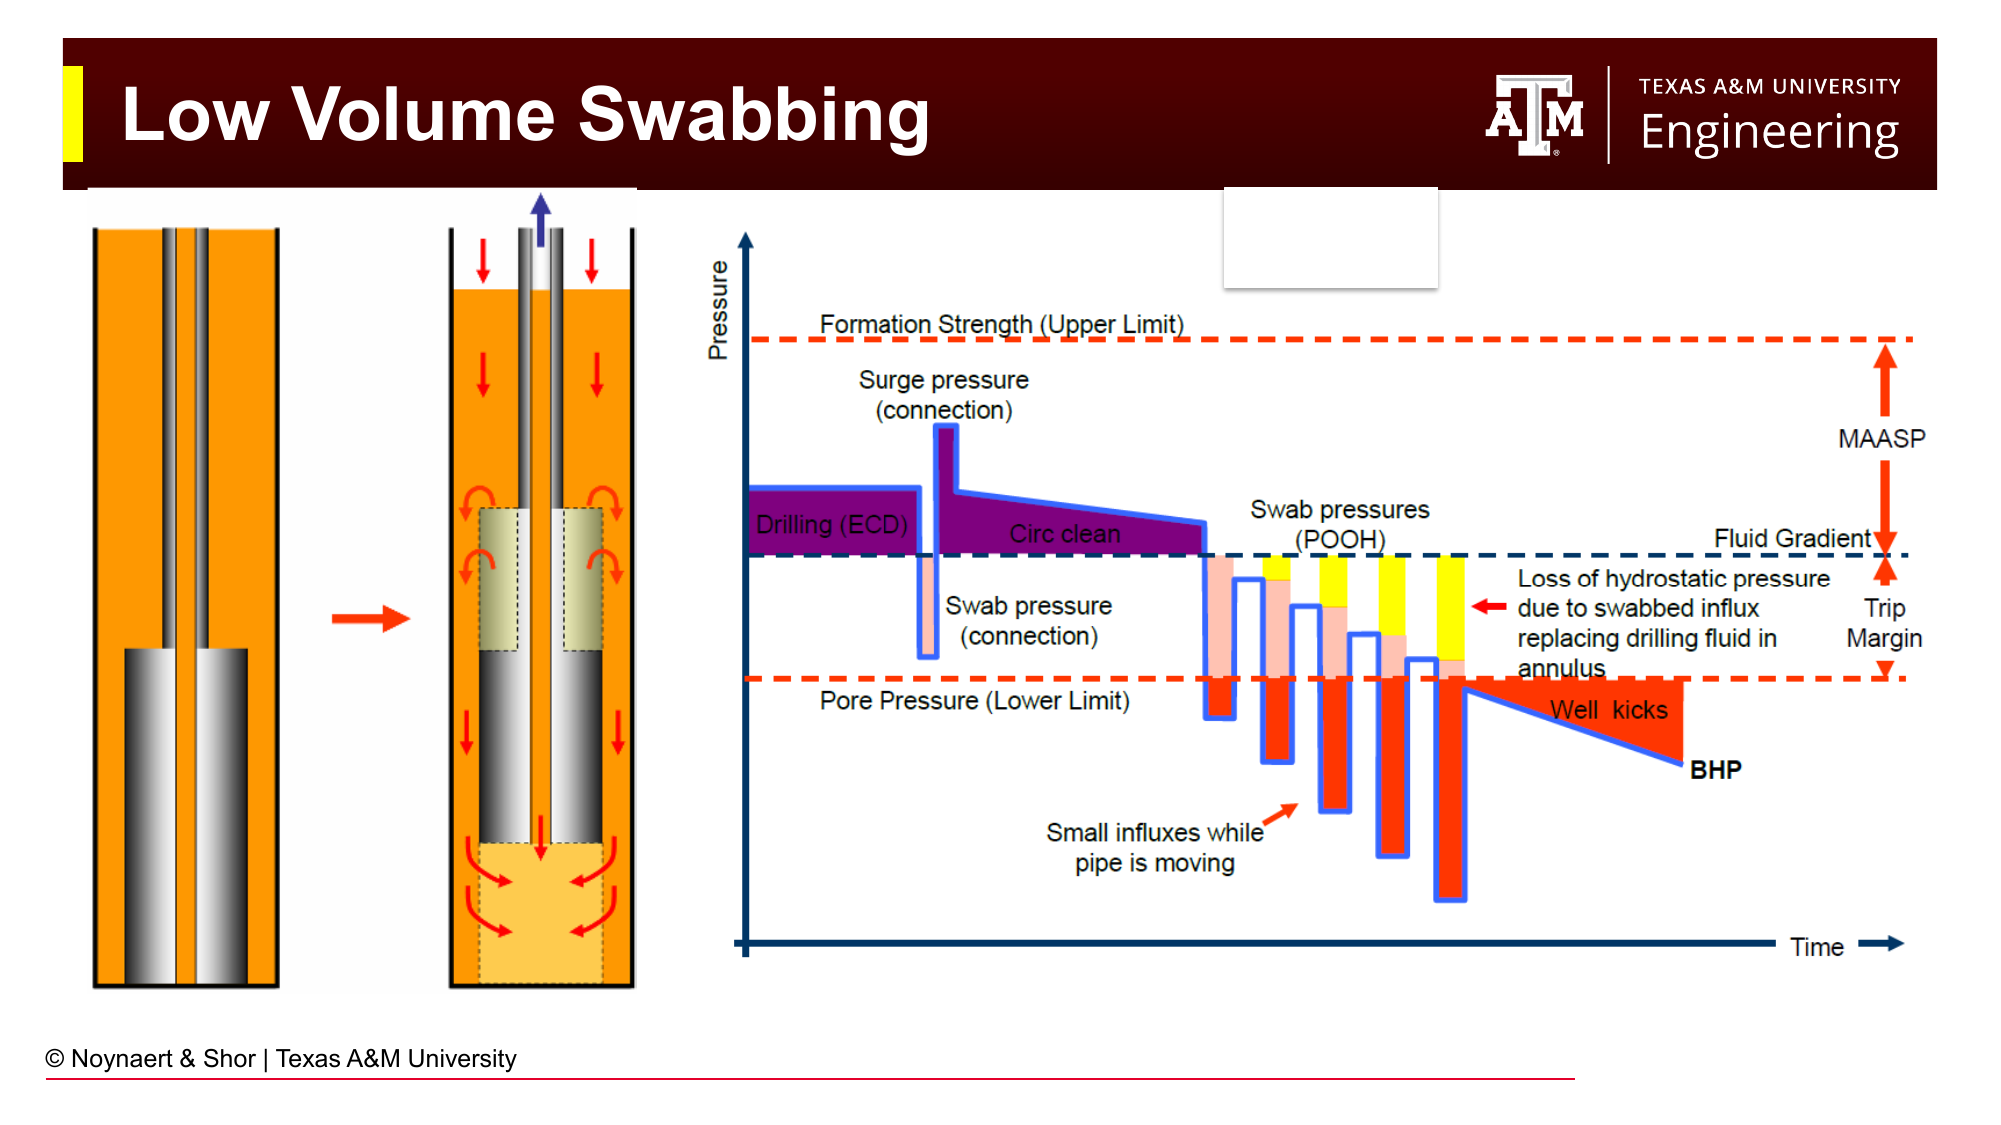
Fig. 117 Low-volume swabbing: each individual pull creates a small pressure pulse that draws a small amount of gas into the wellbore. Cumulatively, over many connections or a full trip, this incremental gas influx can displace enough mud to create a serious kick.#
Low-volume swabbing occurs with each pipe pull, even with an unobstructed bit. The drill string acceleration at the start of each pull creates a brief suction below the bit. In high-pore-pressure formations, a small amount of gas or formation fluid is drawn in with each pull. Over hundreds of pulls during a full trip, these small increments accumulate into a significant kick.
Surging is the opposite of swabbing, and occurs when the drillbit moves downward while tripping into the hole. In this case, pressure directly below the drillbit increases temporarily and can cause fracturing of the wellbore and fluid losses.
8.5.2 Trip Margin#
The trip margin is the amount of overbalance above the minimum required mud weight, specifically reserved as a safety factor against swabbing. It represents the margin by which the static bottomhole pressure can be reduced (by swabbing) before the well kicks:
In practice, a 0.3–0.5 ppg trip margin is maintained. This means the mud weight is held 0.3–0.5 ppg above the minimum required to balance pore pressure, specifically to provide margin for swabbing during trips.
8.6 The Well as a U-Tube#
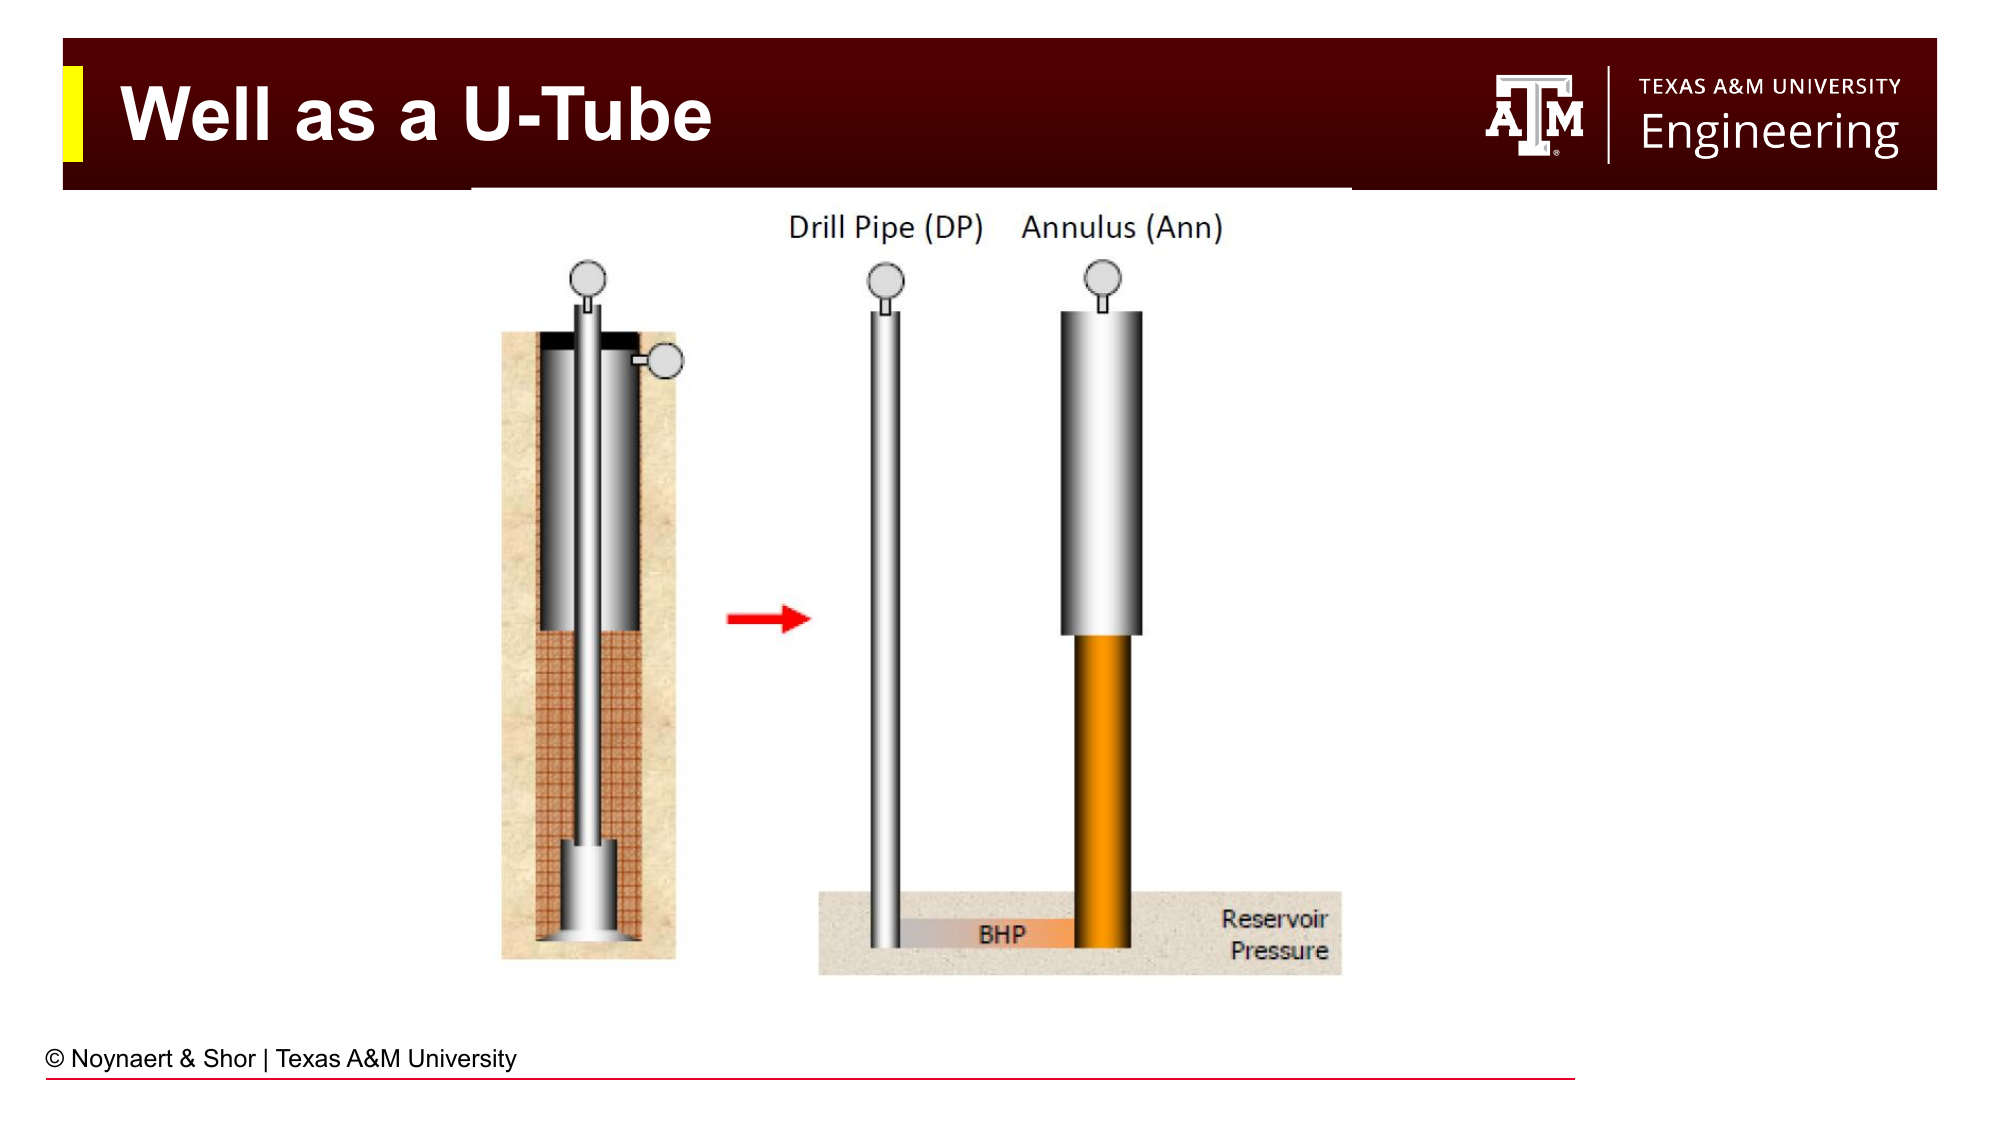
Fig. 118 The wellbore-drillstring system viewed as a U-tube. The drill pipe (left leg) is assumed to be full of drilling mud. The annulus (right leg) may contain mud, formation fluid, or a mixture, depending on whether a kick has occurred.#
The wellbore and drill string can be modeled as a U-tube: two fluid columns connected at the bottom (at the bit). In normal drilling with the pumps off (static condition), if both legs contain the same mud, the pressures at the top of each leg are equal (zero gauge pressure).
When a kick enters the annular side (right leg), the density of the fluid in that leg decreases, gas and oil are lighter than mud. With a lighter fluid in one leg and a heavier fluid (mud) in the other:
Bottomhole pressure from the drill pipe side: \(BHP = \rho_{mud} \times 0.052 \times TVD\)
Bottomhole pressure from the annulus side: \(BHP = \rho_{mud} \times 0.052 \times (TVD - H_{kick}) + \rho_{kick} \times 0.052 \times H_{kick} + SICP\)
where \(H_{kick}\) is the height of the kick and \(SICP\) is the shut-in casing pressure.
Since both sides must be in pressure balance at the bit, and the drill pipe side has no surface pressure (SIDPP ≈ pore pressure minus hydrostatic head):
This is the fundamental equation for determining the formation pore pressure from shut-in pressures.
8.7 Shut-In Pressures#
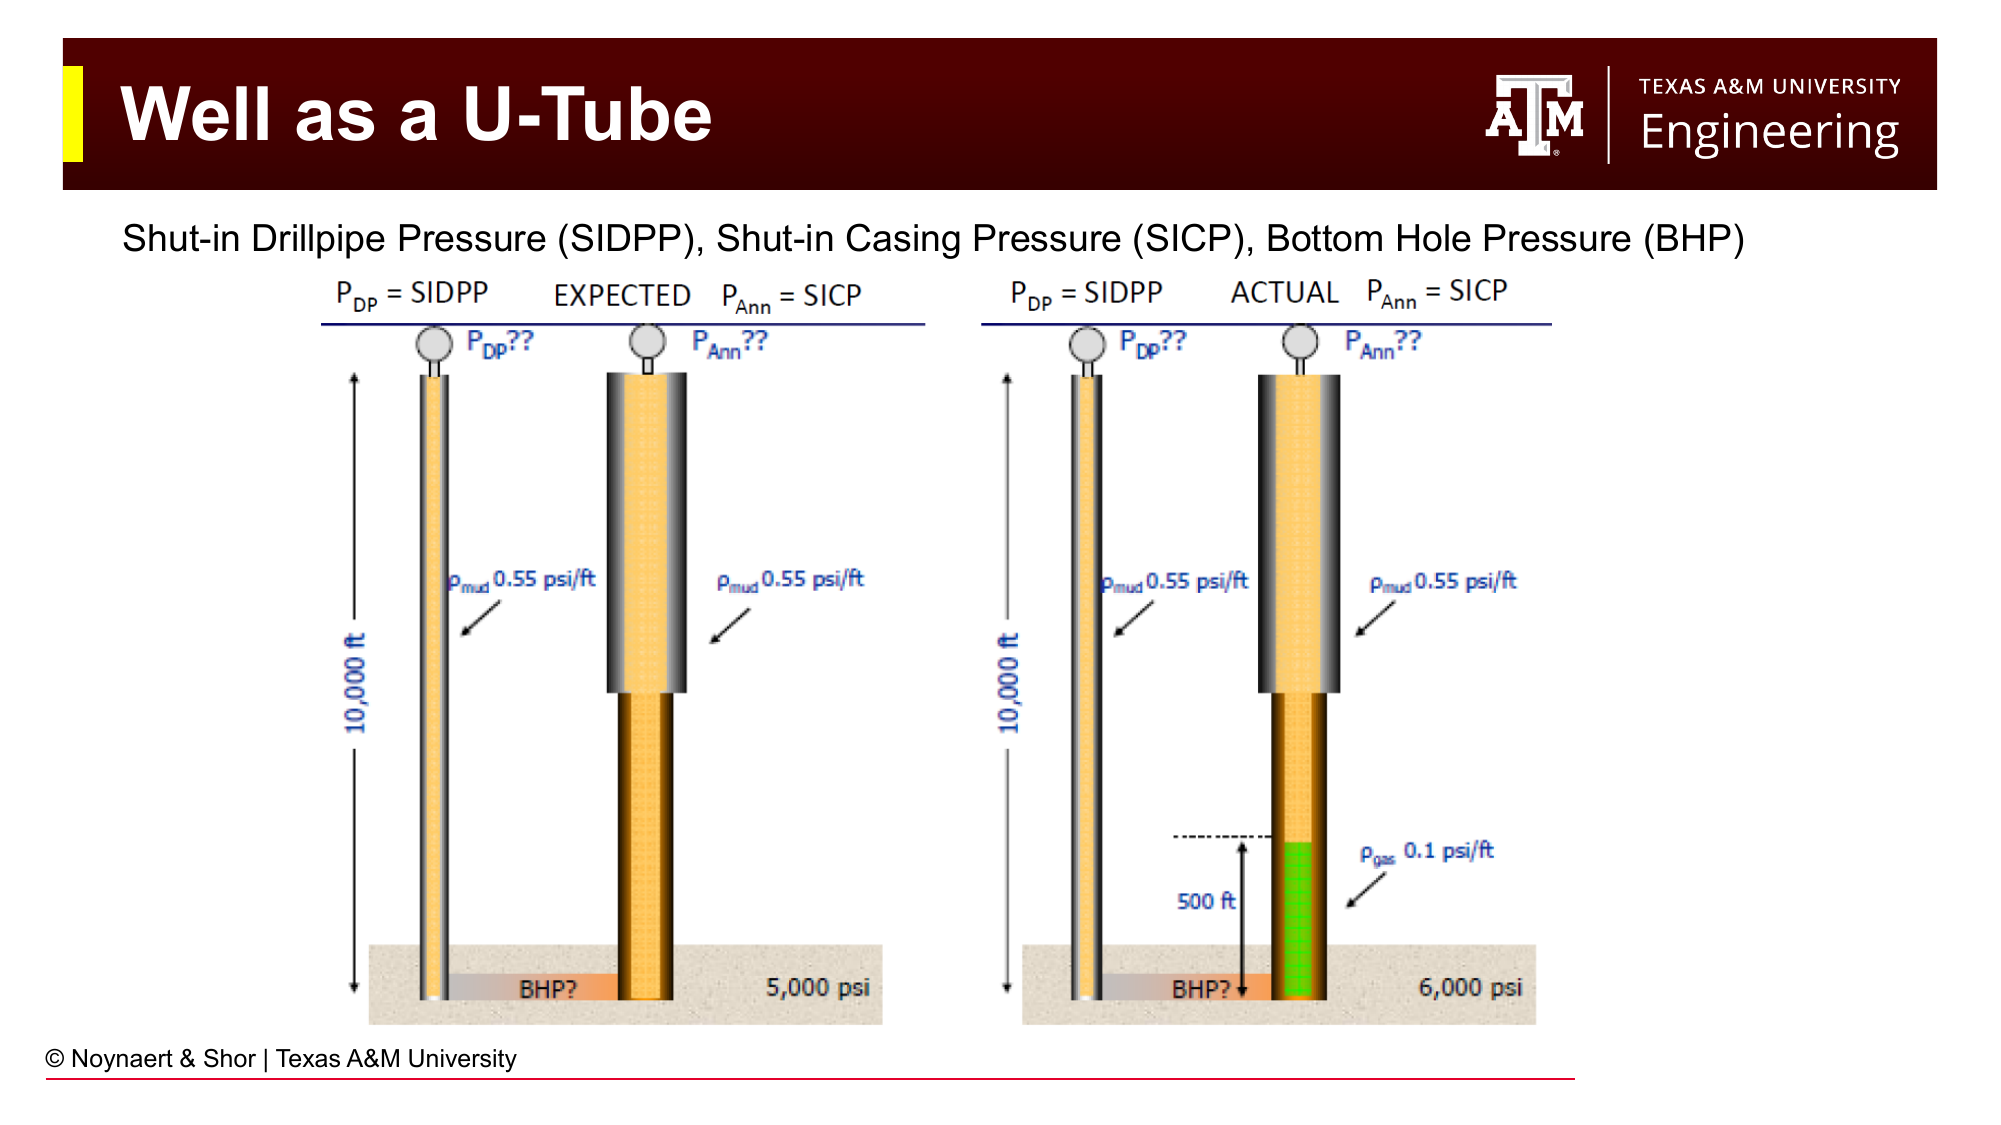
Fig. 119 Shut-in drill pipe pressure (SIDPP) and shut-in casing pressure (SICP) measured at surface after closing the BOPs. SIDPP reflects the BHP minus the full mud-weight hydrostatic column. SICP reflects the BHP minus the partial mud hydrostatic (the kick fluid is lighter, reducing the effective column height).#
After shutting in the well, two pressures are read at surface:
Shut-In Drill Pipe Pressure (SIDPP): The pressure observed on the drill pipe gauge after the well is closed in and pressures have stabilized. This is a direct measure of how much the bottomhole pressure exceeds the hydrostatic head of the mud column in the drill string:
Shut-In Casing Pressure (SICP): The pressure on the annular (casing) side. This is typically higher than SIDPP because the annulus contains kick fluid (lighter than mud), which requires more surface pressure to maintain pressure balance at the bit:
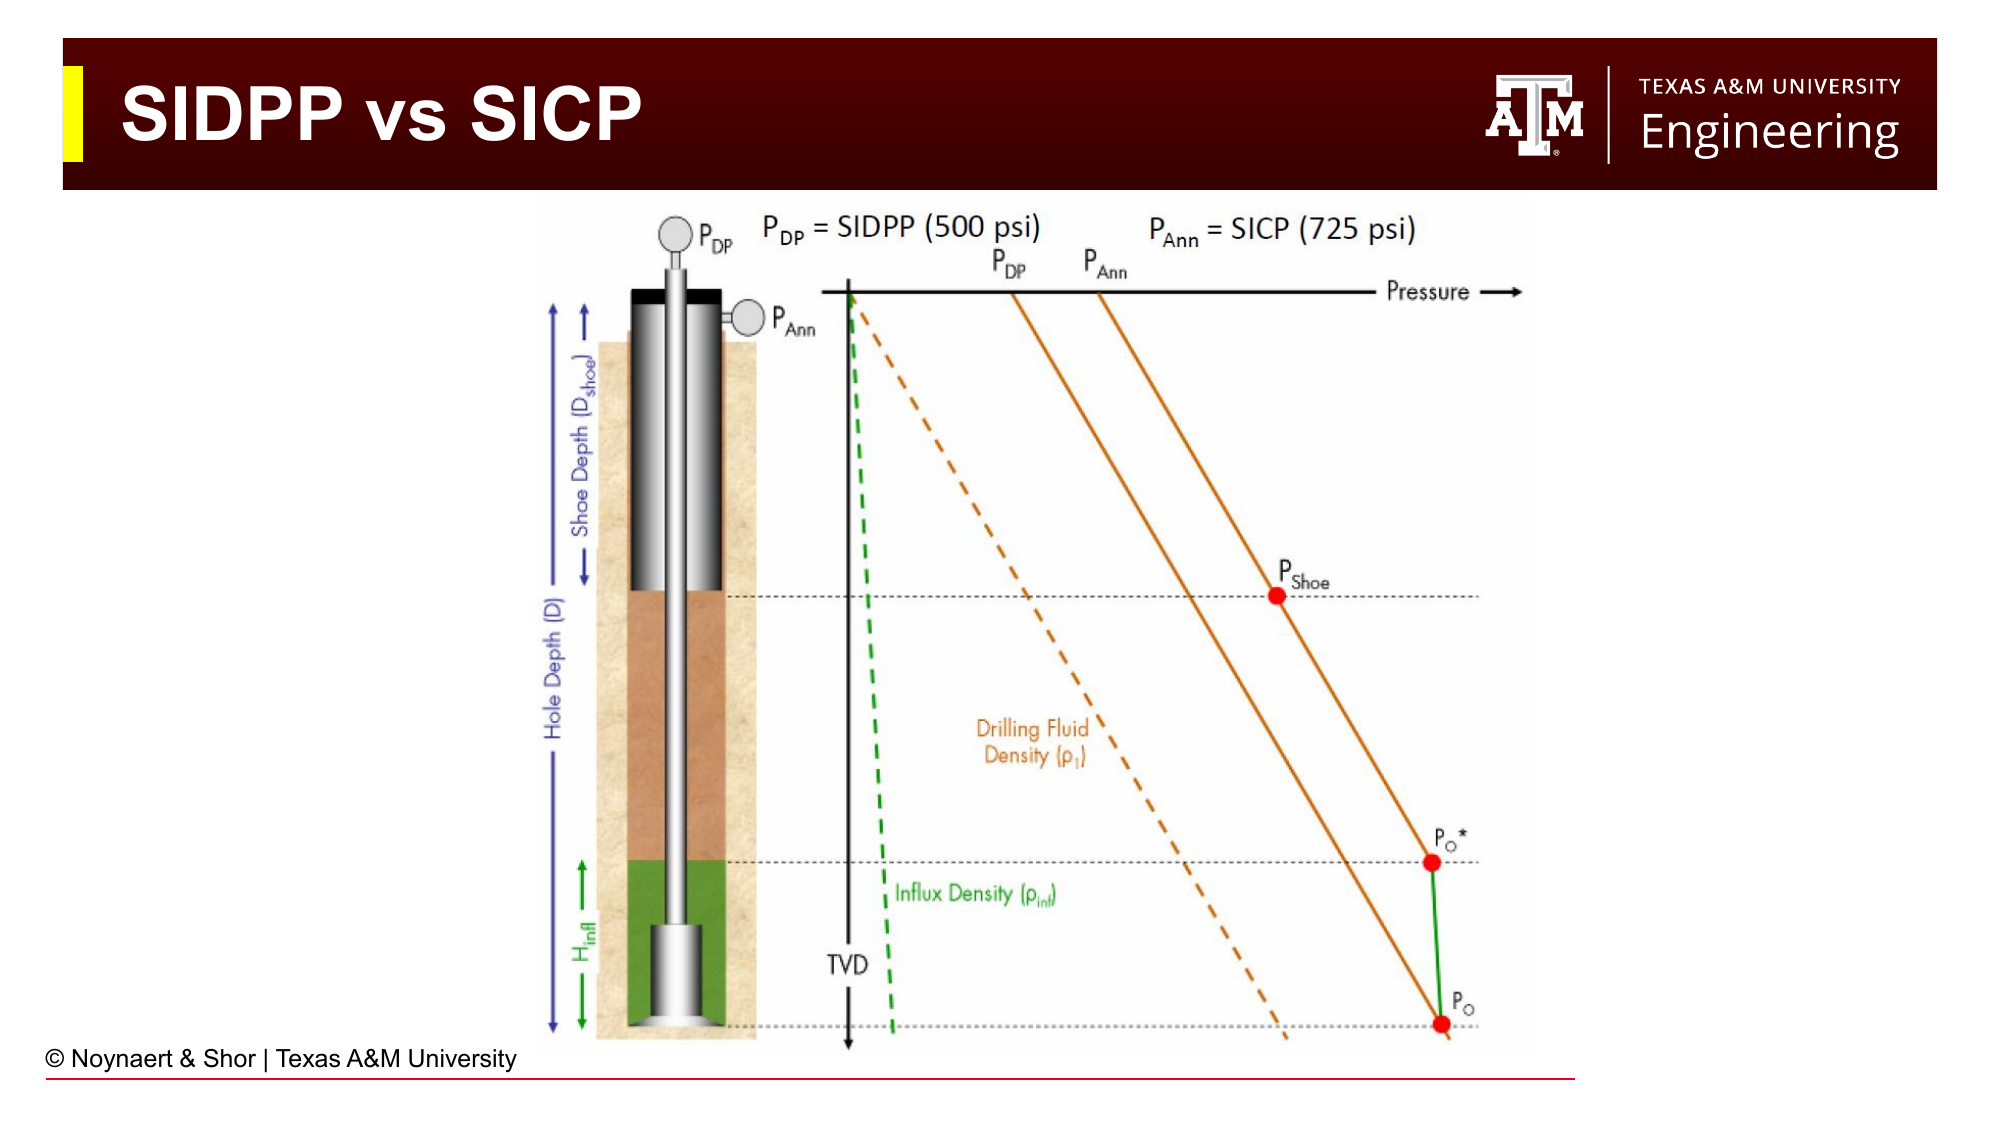
Fig. 120 Pressure diagram showing SIDPP and SICP for a well with a gas kick. SICP > SIDPP because the gas in the annulus is lighter than mud. The difference between SICP and SIDPP, combined with the estimated kick height, can be used to calculate the kick fluid density and identify whether the kick is gas, oil, or water.#
8.7.1 Using SIDPP and SICP Together#
The difference between SICP and SIDPP is directly related to the density and volume of the kick fluid:
where \(H_{kick}\) is the height of the kick (determined from the volume of mud gained and the annular capacity at the kick location).
This equation allows the driller and well control engineer to identify the type of kick:
\(\rho_{kick} \approx 8–9\) ppg: saltwater kick (similar density to fresh water)
\(\rho_{kick} \approx 6–7\) ppg: oil kick
\(\rho_{kick} < 3\) ppg: gas kick (lowest density, highest SICP)
A gas kick is the most dangerous because gas expands as it rises in the wellbore, accelerating the process and generating higher surface pressures than the same volume of liquid.
8.8 Trip Tank and Kick Detection#
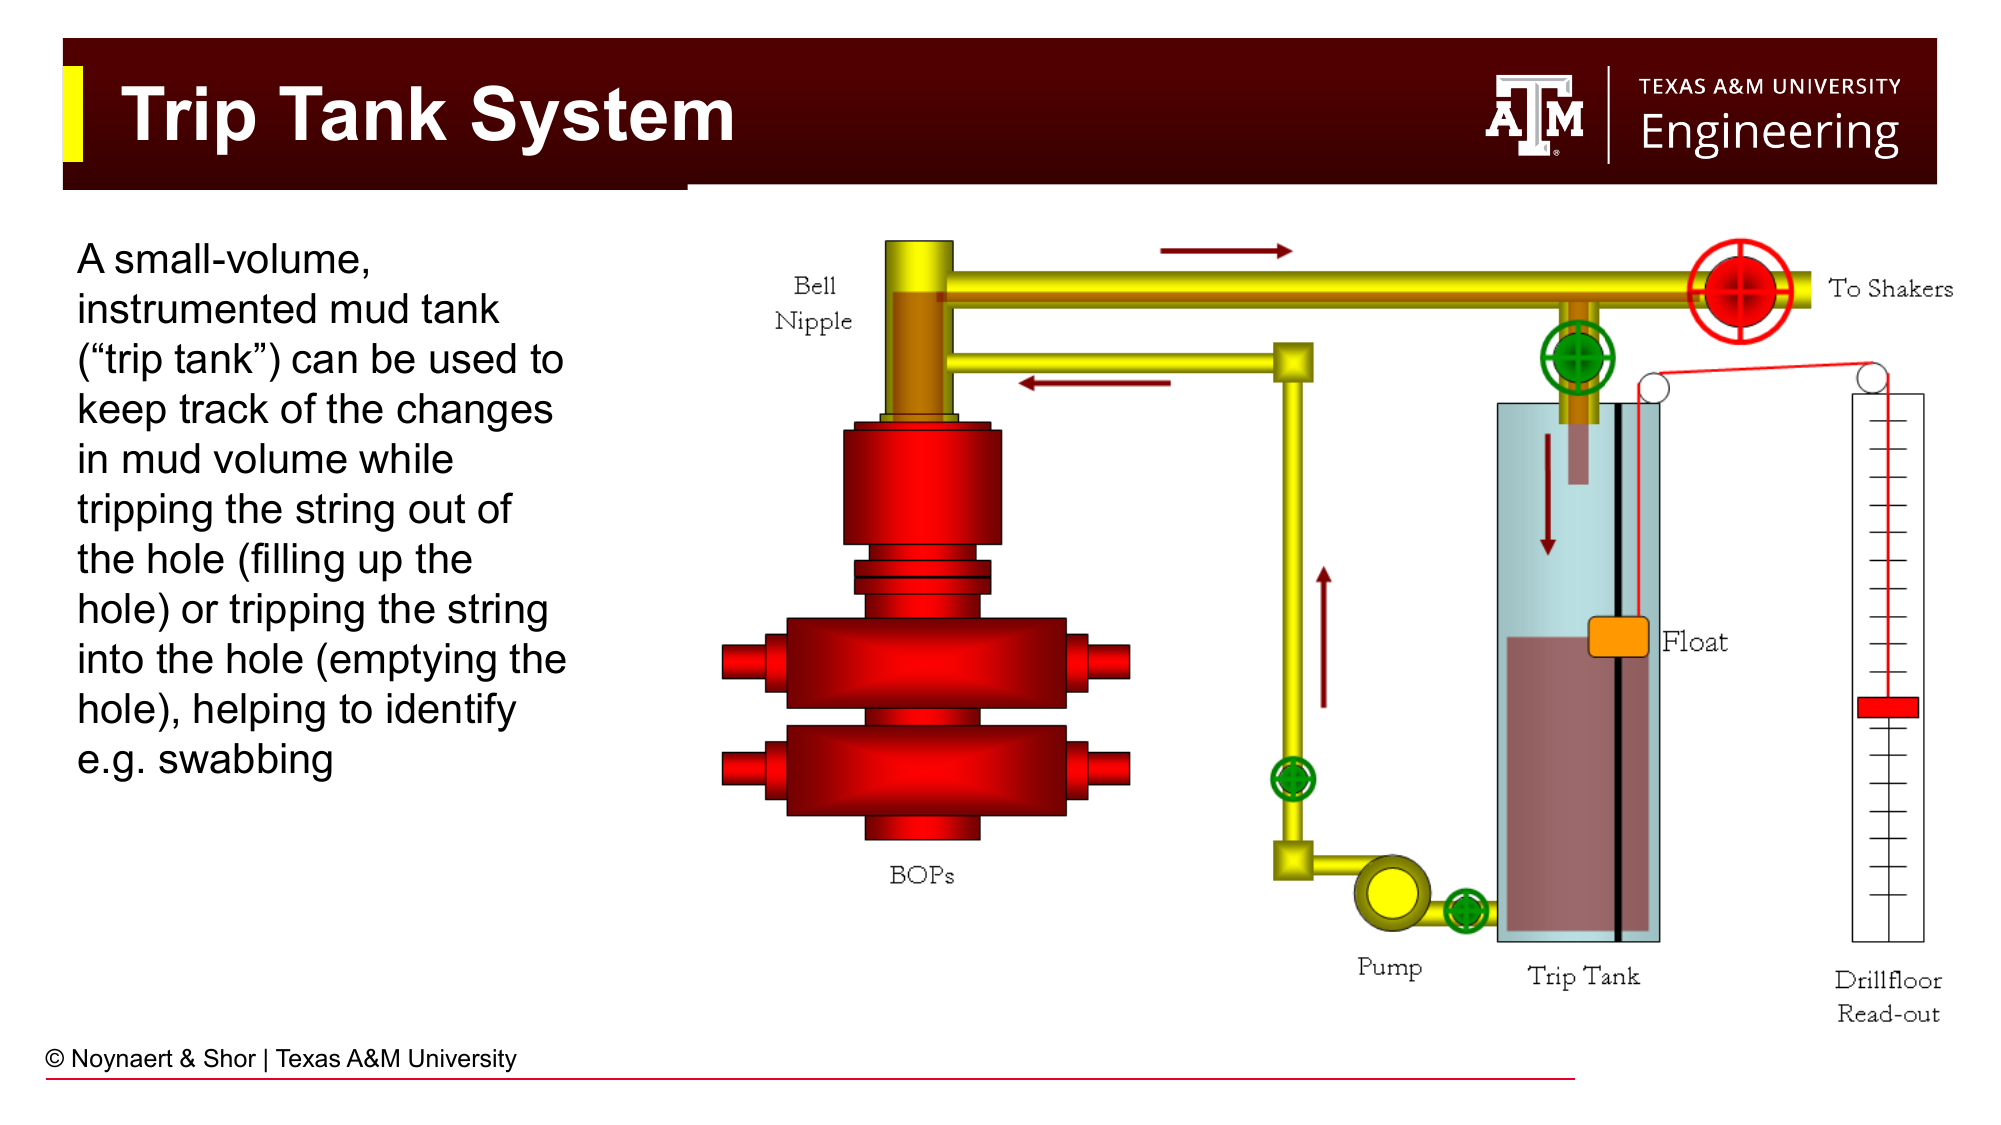
Fig. 121 A trip tank is a small, tall, instrumented mud tank that allows accurate measurement of changes in mud volume during tripping operations. Gains in the trip tank while pulling pipe indicate fluid is entering the wellbore (swabbing or a kick). Losses indicate mud is entering the formation.#
When the drill string is pulled out of the hole, the mud in the annulus must flow downward (from the annulus into the open hole below) to fill the space vacated by each pulled stand of pipe. The volume of mud required to fill the hole is predictable from the steel volume of the pipe. If less mud flows in than expected, formation fluid is contributing (swabbing or kick). If more flows in, mud is being lost to a permeable zone.
The trip tank is a small-volume, tall, instrumented tank used to monitor these volume changes during trips. Because it is small (typically 10–50 bbl capacity, much smaller than the main mud pit), level changes corresponding to small volume gains or losses are more visible on the trip tank than they would be on the main pit. The driller switches to the trip tank system during tripping and monitors it continuously.
Rule of thumb: A gain of 5–10 bbl in the trip tank while tripping out should prompt the driller to stop, fill the hole, and investigate. A gain that continues after stopping is a strong indicator of a kick and should trigger shut-in. This number also relates to typical volumes of influxes: use of a trip tank means a typical influx is between 5 and 15 bbls if the driller is attentive. Use of an automated system, such as one attached to a managed pressure drilling (MPD) system, reduces detectable influxes to 0.5 to 3 bbls, drastically increasing safety. This fact alone is sometimes enough to convince an operator to pay for an MPD system.
8.9 Blowout Preventers and Secondary Equipment#
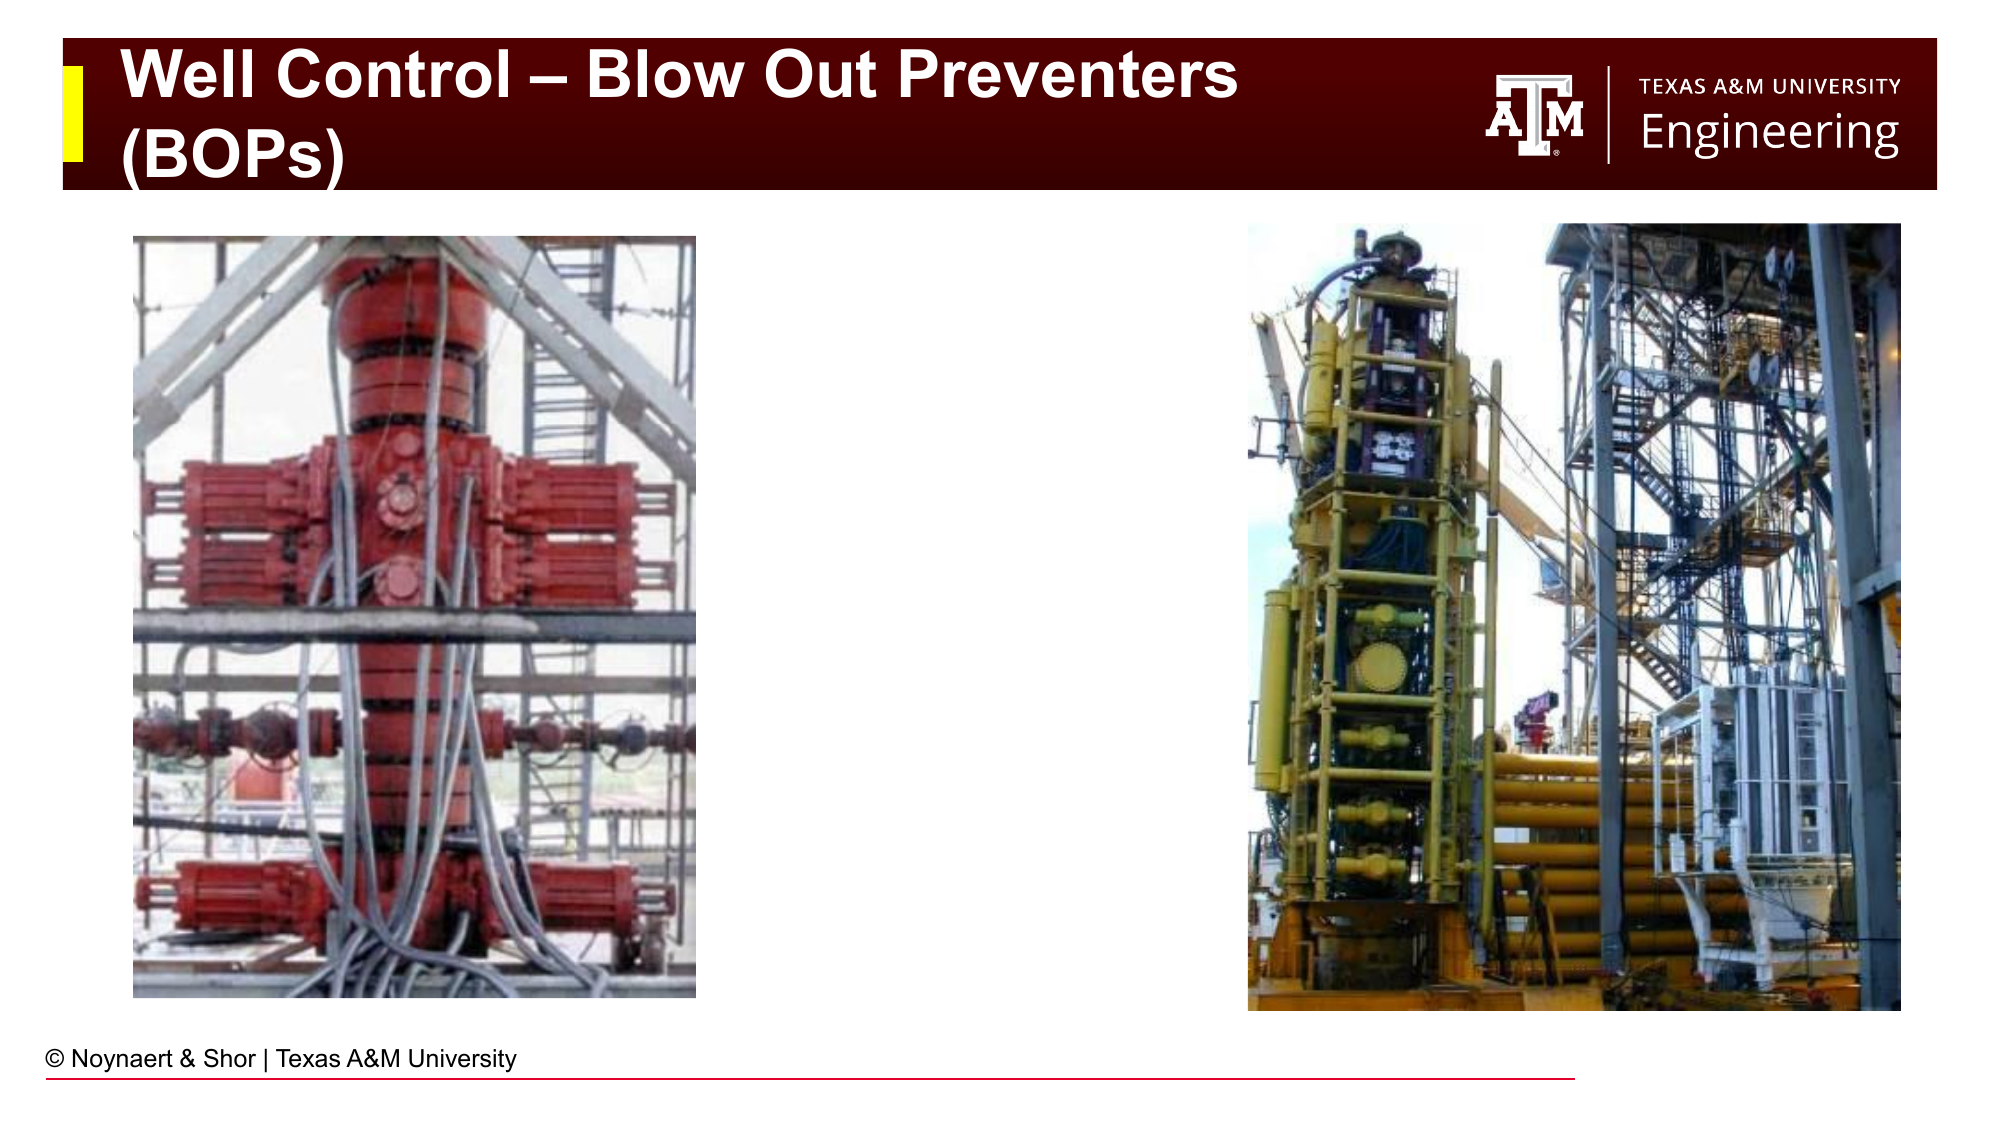
Fig. 122 A BOP stack on an onshore rig. The stack includes annular preventers (top) and pipe rams, blind rams, and shear rams at various positions. The entire stack is rated to a working pressure (e.g., 10,000 psi or 15,000 psi).#
The blowout preventer (BOP) stack is the primary piece of secondary well control equipment. Mounted on top of the wellhead, it is able to seal the annulus (and in emergencies, shear the pipe itself) when a kick is detected.
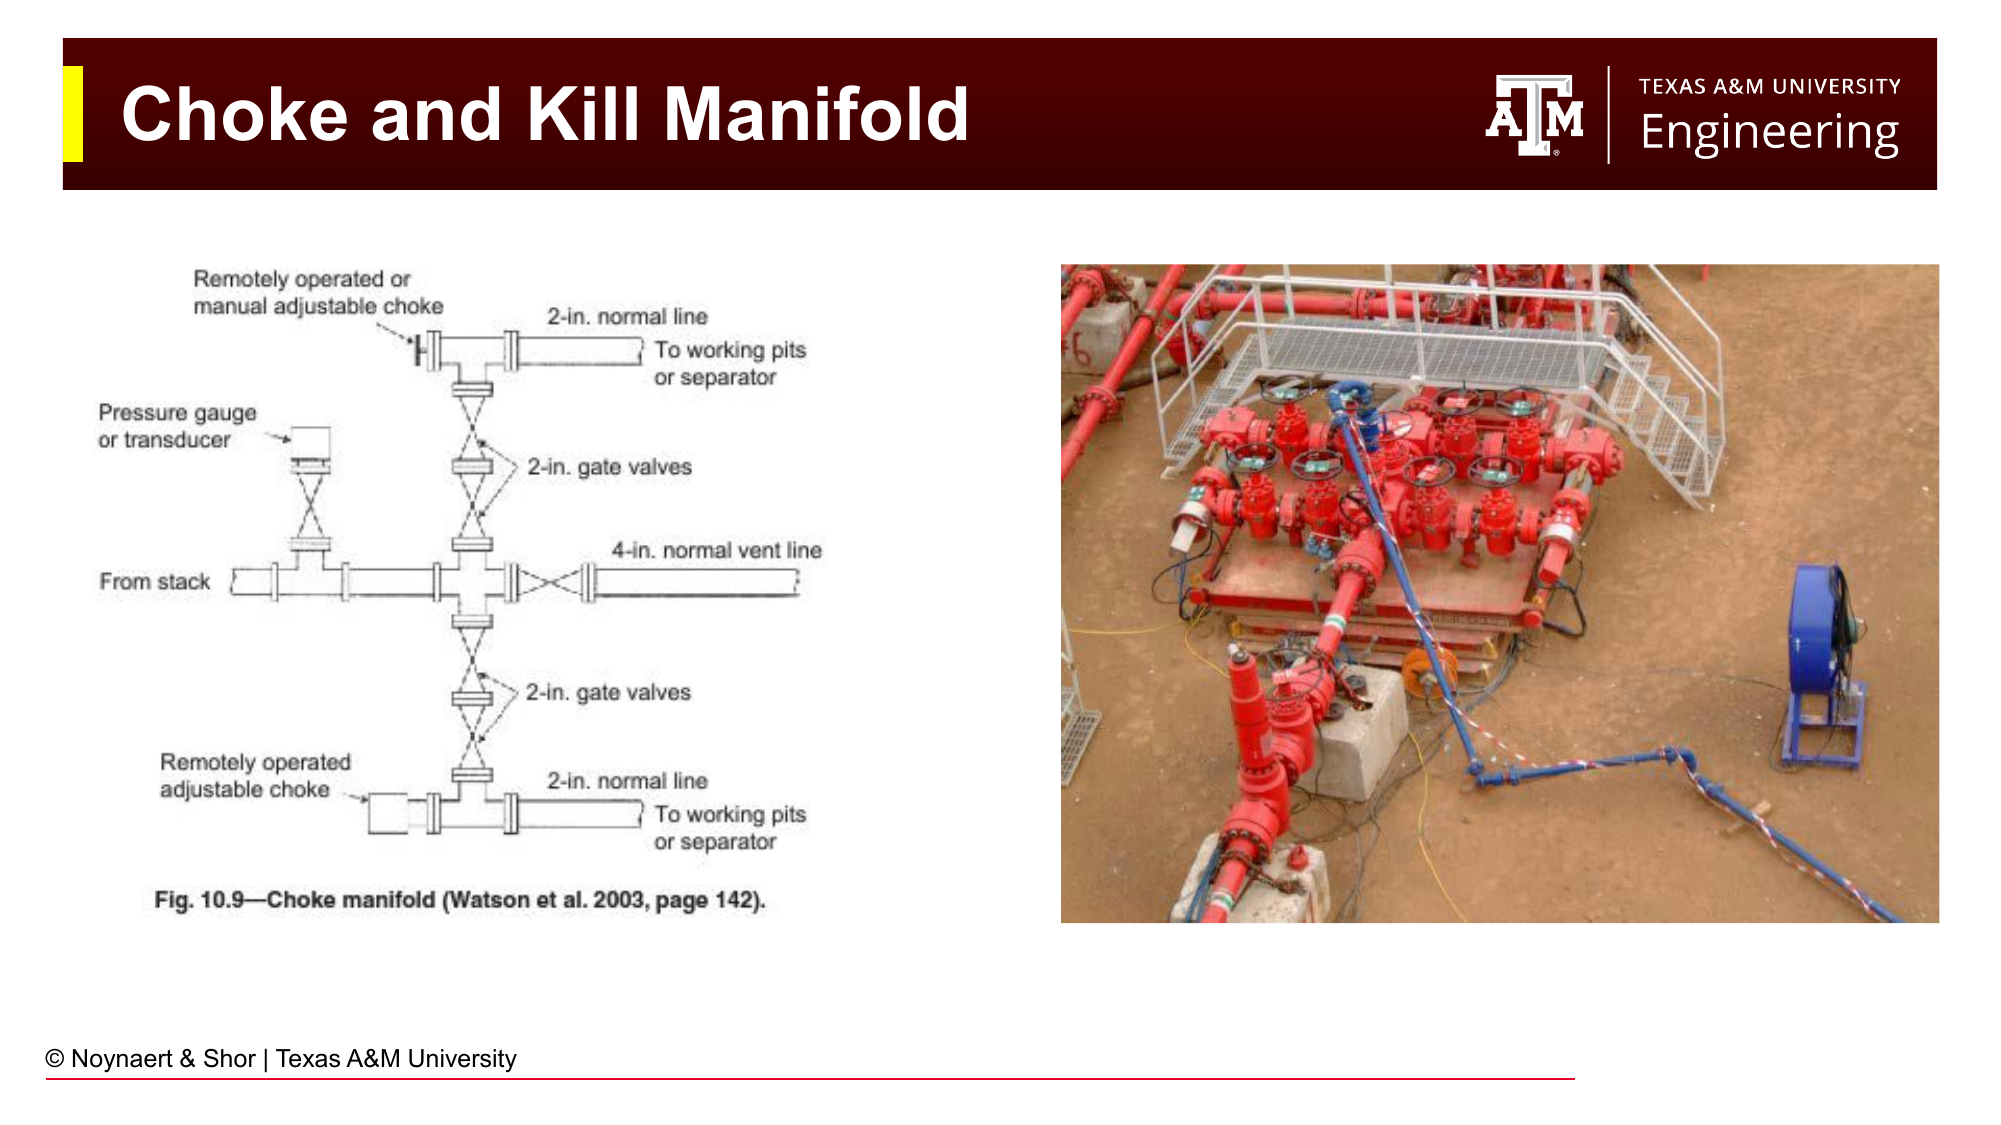
Fig. 123 The choke and kill manifold allows controlled flow of fluid out of the well (through the choke, on the casing side) or injection into the well (through the kill line, on the drill pipe side) during a well kill operation.#
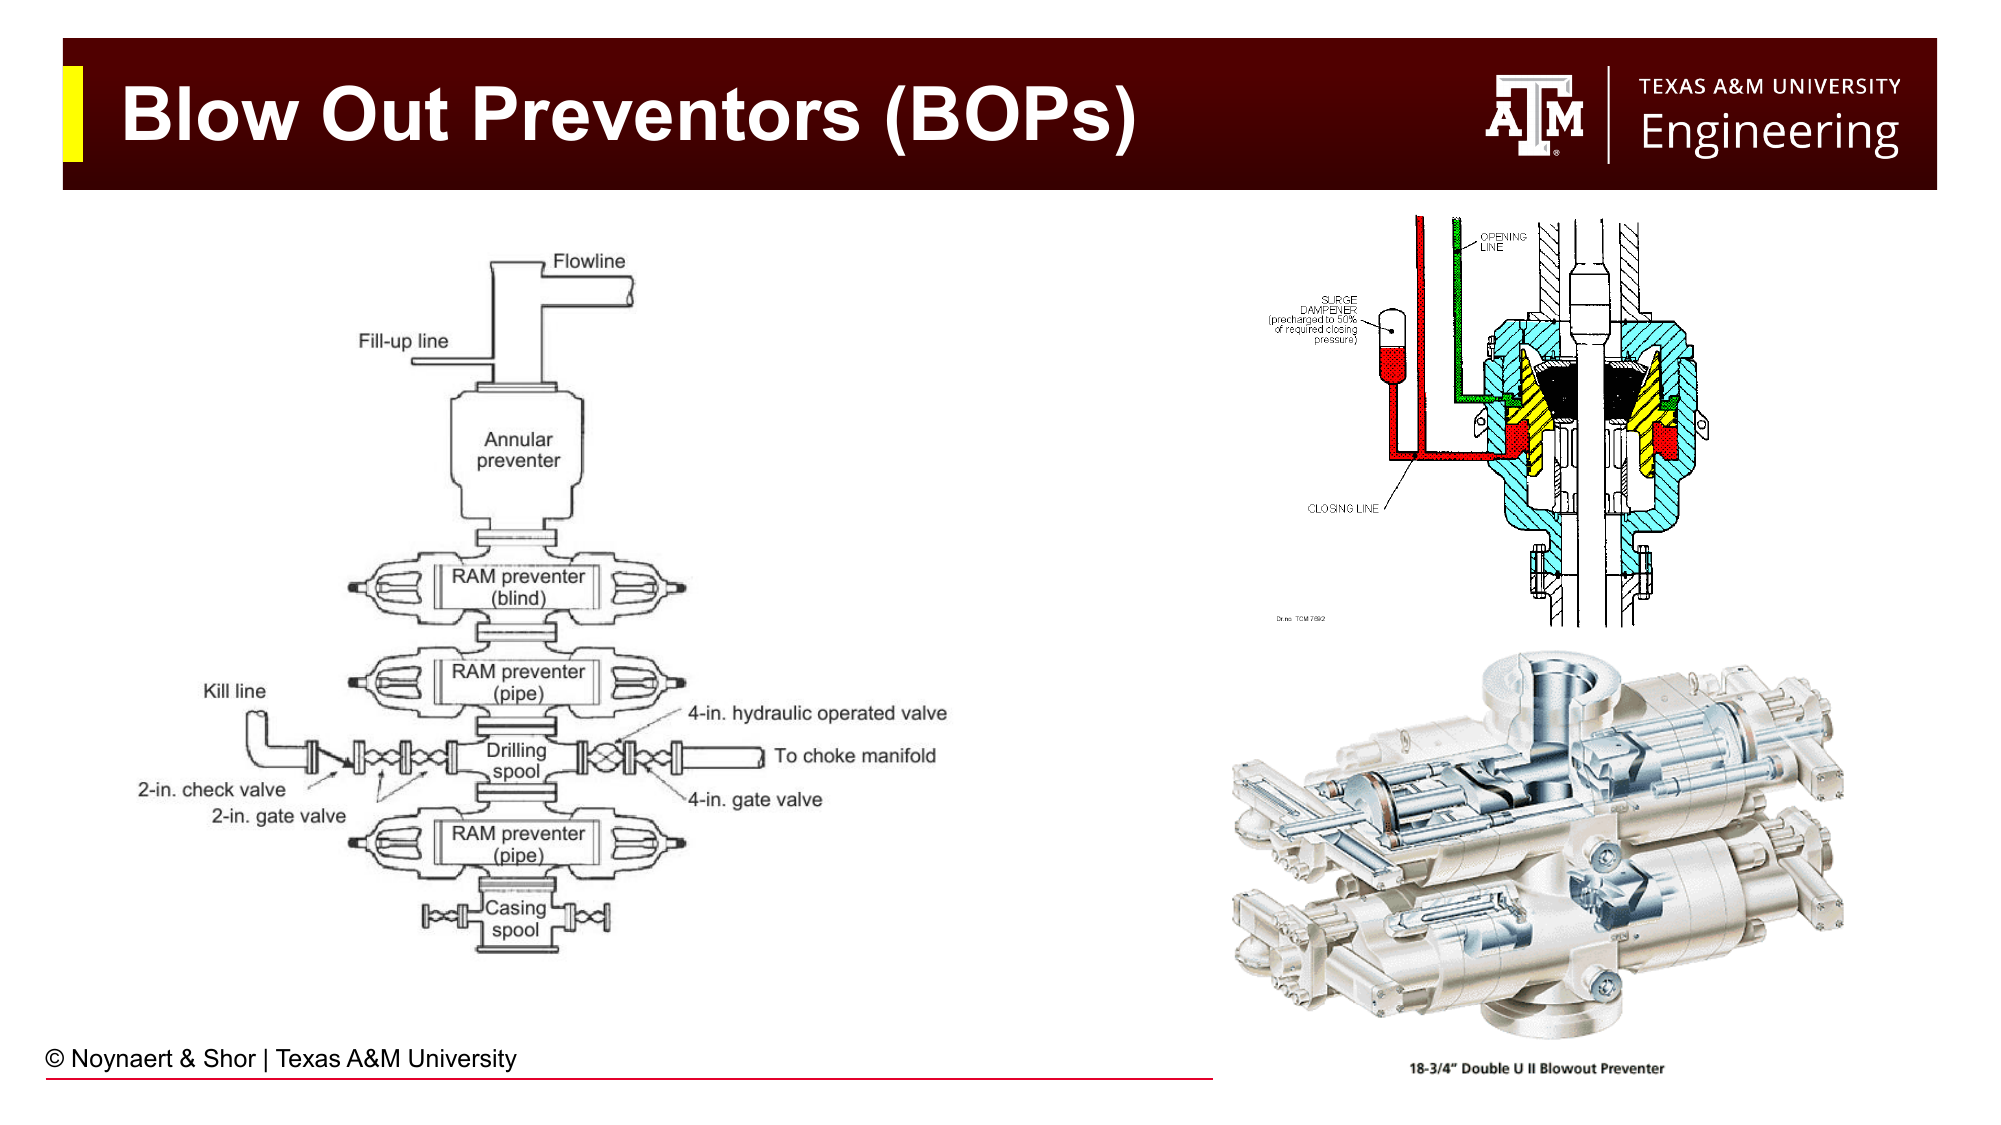
Fig. 124 A BOP stack showing the arrangement of components: annular preventer at top, followed by pipe rams, blind rams, and shear rams. Each provides progressively more drastic sealing capability. The shear/blind rams can cut the drill pipe and seal the wellbore completely, used as a last resort.#
The main BOP components are:
Annular preventer: A rubber donut-shaped element that contracts around the drill string (or closes completely in the absence of pipe) when pressure is applied. Can seal around irregular shapes (drill pipe, HWDP, drill collars, kelly) and is the fastest and most flexible sealing device. Limited pressure rating compared to pipe rams.
Pipe rams: Steel blocks with a semi-circular cutout that matches the drill pipe OD. When closed, they seal against the outside of the drill pipe. Only effective when the pipe body is in the BOP; cannot seal around connections or larger components.
Blind rams: Solid steel blocks that seal the wellbore completely when no pipe is present (or when the well must be sealed after the pipe has been removed). Cannot cut pipe.
Shear rams: Similar to blind rams but with hardened cutting edges that can sever the drill string. Used as a last resort to close the wellbore even if pipe is in the BOP. After shearing, the well is sealed but the drill string is disconnected and dropped. Shear rams may or may not be able to cut through connections and typically cannot cut through thicker pipe (i.e., HWDP or the BHA). It is critical to space out the drillstring properly during a well shut in to ensure there are no connections inside the BOP.
Choke and kill manifold: Piping connected to the annular side of the BOP stack. The choke controls the flow rate out of the well during kill operations (maintaining backpressure to hold formation fluid in the formation). The kill line allows pumping of heavy kill mud into the annulus from the manifold side.
8.10 Secondary Well Control: Shutting In the Well#
When a kick is detected, the well must be shut in as quickly as possible. Time is critical: the longer formation fluid flows into the wellbore, the larger the kick volume, and the more complex and dangerous the well kill operation.
Detection indicators:
Increase in pit volume (mud gains in the active pit)
Increased flow from the wellbore while pumps are on
Flow from wellbore after pumps are stopped
Decrease in standpipe pressure (with pumps on)
Increase in rate of penetration (drilling into over-pressured zone)
Change in trip tank level while tripping
Shut-in procedure (simplified):
Stop drilling and raise the bit off bottom.
Space out the drill string — position the tool joint (connection) above the BOP stack. BOPs can seal around the pipe body but not around a thick tool joint.
Notify the company man (operator’s representative) and well control team.
Close the BOP — annular preventer first for soft shut-in, pipe ram for hard shut-in.
Divert flow through the choke manifold.
Slow down the pumps (do not stop abruptly — allow the choke to take control first).
Close the choke, gradually for a soft shut-in, or quickly for a hard shut-in, to achieve full shut-in.
Read and record SIDPP and SICP once pressures stabilize.
Calculate kick volume from pit gain.
Notify well control specialist and prepare the kill operation.
Soft shut-in vs. hard shut-in:
In a soft shut-in, the choke is slightly open while the BOP is being closed, preventing a sudden pressure spike. Some operators prefer this to avoid a “water hammer” pressure surge.
In a hard shut-in, the BOP is closed immediately with no flow allowed. This minimizes the volume of kick taken but creates a brief pressure spike. Most modern practice uses hard shut-in because the volume gained during soft shut-in may not be negligible.
8.11 Well Kill Methods#
Once the well is shut in and SIDPP and SICP have been recorded, the engineer determines the kill mud weight, the mud density that will provide exactly zero surface pressure while balancing the formation pore pressure:
Two main methods are used to remove the kick and restore primary well control:
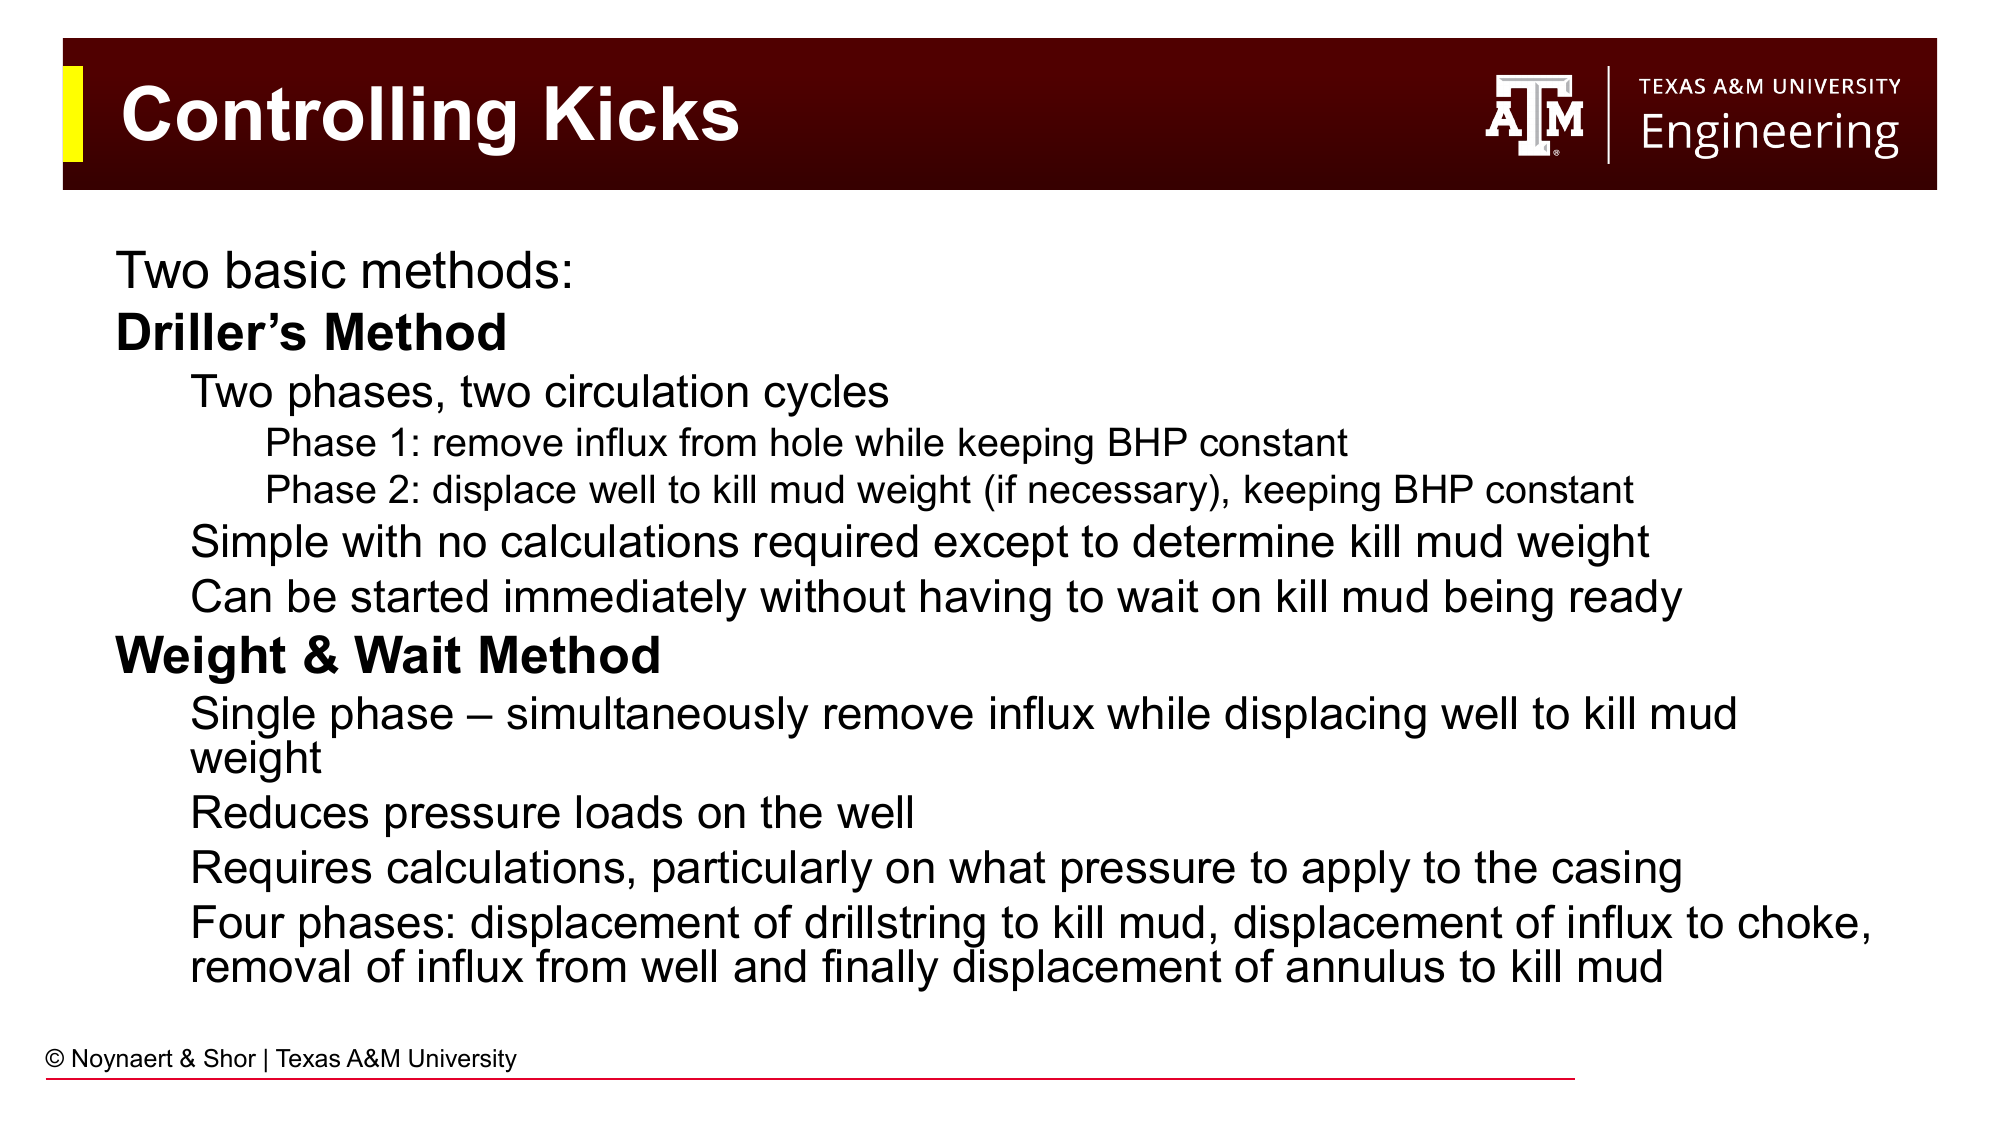
Fig. 125 Comparison of the Driller’s Method (two-phase: remove kick first, then weight up) and the Wait-and-Weight Method (one-phase: circulate kill mud while removing kick). Both maintain constant bottomhole pressure throughout by controlling the choke backpressure.#
8.11.1 Driller’s Method (Two-Circulation Method)#
Phase 1: Circulate the kick out of the wellbore using the existing mud. The kick fluid rises in the annulus as mud is pumped down the drill pipe. Backpressure on the choke is adjusted to maintain constant SIDPP (and thus constant BHP) as the lighter kick fluid rises.
Phase 2: Once the wellbore is free of kick fluid, circulate kill-weight mud from the pits down the drill string and up the annulus until the entire system is displaced to kill mud. Bottomhole pressure is maintained constant during this phase as well.
Advantages:
Can be started immediately — no waiting for kill mud to be mixed
Simpler pressure calculations (only one variable per phase)
Gets rid of the kick quickly
Disadvantages:
Two full circulation cycles required — more time at non-kill mud weight
Formation sees elevated pressure during Phase 1 (choke-applied backpressure + hydrostatic of existing mud), particularly at the casing shoe
8.11.2 Wait-and-Weight Method (Engineer’s Method)#
Single phase: Prepare kill-weight mud (which takes time to mix and weight up) and then circulate once, pushing kill mud down the drill string and simultaneously displacing the kick up and out of the annulus. The choke pressure is adjusted throughout to maintain constant BHP.
The choke pressure schedule is calculated in advance: as kill mud fills the drill string, less choke pressure is needed to maintain the same BHP; when the kill mud reaches the bit and starts coming up the annulus, the lighter kick fluid is being displaced and the schedule adjusts accordingly.
Advantages:
Only one circulation cycle required
Lower peak pressure on the formation (especially critical if the shoe strength is marginal)
Kill mud displacement provides continuous stabilization
Disadvantages:
Requires waiting to mix kill mud (delay in starting the kill)
Requires careful pre-calculation of the choke pressure schedule
During the wait, the kick may migrate upward in the wellbore, complicating the calculation
8.11.3 Key Constraint: MAASP#
Throughout either kill method, the annular surface pressure (read on the casing pressure gauge) must never exceed the MAASP. If the casing pressure approaches MAASP, the kill operation must be paused or the choke must be opened slightly to bleed pressure, even if this means allowing the bottomhole pressure to rise briefly above the original pore pressure. Exceeding MAASP would fracture the formation at the shoe, creating an underground blowout path and escalating the situation.
8.11.4 Choosing the Right Well Control Method#
Choice of well control method will depend on a variety of factors:
Company Policy - some companies mandate the use of a specific method as a best practice or as a mandate based on prior experience
Formation Strength - the results from the LOT of the previous casing shoe may require the use of the wait-and-weight method to reduce wellbore pressures
Availability of Mud Pits - the driller’s method necessitates the use of a secondary mud pit to mix the kill mud The choice is usually made during the design phase of the well, and is not a game day decision. A detailed plan to control an influx means that everyone can go home that day and the well can still be delivered on time and safely.
Worked Examples#
Example 8.1 — Formation Pressure Identification#
Problem: A well is being drilled in an offshore Gulf of Mexico basin. The following information is known:
Water depth: 6,000 ft; seafloor pore pressure ≈ seawater hydrostatic (8.55 ppg)
At 12,000 ft TVD below the water surface (6,000 ft below seafloor), the predicted pore pressure is 8.80 ppg EMW
At 15,000 ft TVD, the pore pressure prediction from seismic data is 14.2 ppg EMW (a known overpressured zone)
At 18,000 ft TVD, the pore pressure is 15.8 ppg EMW
(a) Calculate the pore pressure in psi at 12,000 ft, 15,000 ft, and 18,000 ft TVD.
(b) Is the zone at 15,000 ft TVD normally pressured, sub-normally pressured, or over-pressured? Explain the likely mechanism.
(c) What minimum mud weight (ppg) would be needed to drill to each depth? Assume a 0.3 ppg trip margin.
Solution:
(a) Pore pressures:
(b) At 15,000 ft TVD:
Normal pore pressure at 15,000 ft (assuming seawater brine, 8.55 ppg): \(0.052 \times 8.55 \times 15{,}000 = 6{,}674\) psi = 8.55 ppg EMW.
The actual pore pressure (14.2 ppg = 11,076 psi) is significantly above normal — this is an over-pressured zone. At nearly 14.2 ppg, the pore pressure is approaching the overburden gradient.
The most likely mechanism in a deepwater GoM setting is compaction disequilibrium in over-pressured shales combined with the gas effect: rapid Tertiary-age burial of shales trapped pore fluids under high overburden stress, and the target zone contains a gas accumulation sealed by the over-pressured shale.
(c) Required mud weight (with 0.3 ppg trip margin):
Note the enormous jump in required mud weight between 12,000 ft (9.10 ppg) and 15,000 ft (14.5 ppg). This 5.4 ppg increase over 3,000 ft cannot be handled with a single mud weight — the 14.5 ppg mud would fracture the shallow formation at 12,000 ft. At least one intermediate casing string must be set before drilling through the pressure transition zone.
Example 8.2 — MAASP Calculation and Shut-In Pressure Analysis#
Problem: A well has the following configuration:
Last casing shoe at 10,000 ft TVD; LOT result: 17.2 ppg EMW at the shoe
Current mud weight: 12.5 ppg
Drilling at 14,500 ft TVD
While making a connection, the driller notices 8 bbl of pit gain over 10 minutes with the pumps off. The well is shut in. After stabilization:
SIDPP = 320 psi
SICP = 510 psi
The annular capacity between the drill collars (6.75 in OD) and the 9.875-in open hole is 0.0515 bbl/ft.
(a) Calculate the MAASP.
(b) Calculate the actual bottomhole pressure (BHP) from SIDPP.
(c) What is the formation pore pressure in ppg EMW?
(d) Estimate the kick height (ft) from the pit gain.
(e) Estimate the kick fluid density (ppg). Is this likely a gas, oil, or water kick?
(f) Calculate the required kill mud weight.
Solution:
(a) MAASP:
The annular surface pressure must never exceed 2,444 psi during the kill operation.
(b) Bottomhole pressure from SIDPP:
(c) Formation pore pressure in ppg EMW:
The mud weight (12.5 ppg) was slightly below the pore pressure (12.93 ppg) — a 0.43 ppg underbalance, confirming the kick.
(d) Kick height:
(e) Kick fluid density:
This gives a negative result, which is physically impossible and indicates either that the kick is very light (gas) with very low density, or that the simple formula has limitations when the kick is short. Let’s recalculate to confirm: \(0.052 \times 155 = 8.06\); \(190 / 8.06 = 23.6\). The result \(12.5 - 23.6 = -11.1\) ppg is indeed negative — indicating the kick fluid has essentially zero or near-zero effective density.
This is characteristic of a gas kick. For a gas kick where \(\rho_{kick} \approx 0.5\)–1.5 ppg (gas at high pressure), the simple formula breaks down because the fluid compressibility becomes important and the density changes with depth. This is a signal to call a well control specialist.
Given SICP = 510 psi > SIDPP = 320 psi with only 155 ft of kick, the kick fluid is definitely very low density — a gas kick, consistent with drilling into an over-pressured gas zone.
(f) Kill mud weight:
Round to 13.0 ppg for operational purposes (slightly above the calculated requirement for a safety margin).
Example 8.3 — Driller’s Method vs. Wait-and-Weight#
Problem: A gas kick has been taken and the following information is available:
Mud weight: 11.2 ppg
Kill mud weight: 12.1 ppg (already calculated from SIDPP)
Drill string volume: 620 bbl
Annular volume: 830 bbl
Pump output: 0.105 bbl/stroke
SIDPP = 470 psi; SICP = 780 psi
MAASP = 1,850 psi
(a) How many strokes are needed for each phase of the Driller’s Method?
(b) The engineer considers using the Wait-and-Weight Method instead. Estimate how long it takes to weight up 630 bbl of kill mud from 11.2 to 12.1 ppg (assume the rig can add barite at a rate equivalent to increasing density by 0.05 ppg per minute).
(c) The SICP is 780 psi and MAASP is 1,850 psi. What is the safety margin? Is there a risk of exceeding MAASP?
(d) As the gas kick rises in the annulus toward surface during Phase 1 of the Driller’s Method, what happens to the annular surface pressure (SICP)? How is this managed?
Solution:
(a) Strokes for Driller’s Method:
Phase 1 (circulate kick out with existing mud):
Volume to circulate = annular volume = 830 bbl
Strokes = \(830 / 0.105 = \mathbf{7{,}905 \text{ strokes}}\)
Phase 2 (circulate kill mud through entire system):
Volume to circulate = drill string + annulus = \(620 + 830 = 1{,}450\) bbl
Strokes = \(1{,}450 / 0.105 = \mathbf{13{,}810 \text{ strokes}}\)
Total: \(7{,}905 + 13{,}810 = \mathbf{21{,}715 \text{ strokes}}\)
(b) Time to weight up for Wait-and-Weight:
Kill mud volume needed ≈ drill string volume (need to fill the drill string with kill mud before it reaches the bit): 620 bbl minimum; use full system 1,450 bbl for complete kill.
Time to weight 630 bbl (approximately one full drill string volume) from 11.2 to 12.1 ppg:
Change needed: \(12.1 - 11.2 = 0.9\) ppg
Time = \(0.9 / 0.05 = 18\) minutes to reach target weight
But must also have enough volume: mixing time depends on pit capacity
Practical estimate: weighting up 630 bbl by 0.9 ppg requires adding approximately \(\frac{1{,}470 \times 0.9}{35 - 12.1} \times 630 = \frac{1{,}323}{22.9} \times 630 / 42 \approx 865\) sacks of barite. At typical field barite addition rates of ~50 sacks/minute, this takes about 17 minutes.
So the Wait-and-Weight method would delay the kill start by approximately 17–25 minutes compared to the Driller’s Method.
(c) Safety margin on MAASP:
This is a comfortable margin. However, SICP will increase during Phase 1 as the gas kick rises toward surface. As long as the gas is at depth, its pressure contribution to SICP is partly absorbed by the mud column. As it rises, that absorption decreases, and SICP grows. The crew must monitor SICP continuously against MAASP.
(d) Managing rising gas during Phase 1:
As the gas bubble rises in the annulus, it expands (lower pressure at shallower depth). The expanding gas displaces mud downward, which increases the pressure on the casing string and at the shoe. The choke operator must continuously open the choke to bleed gas and maintain a constant BHP (held equal to the formation pore pressure via constant SIDPP). The annular surface pressure will fluctuate as gas rises and must be held below MAASP at all times by adjusting the choke.
If SICP approaches MAASP, the pumps may be briefly slowed or a controlled bleed-off performed to reduce surface pressure, accepting a brief period of elevated BHP rather than fracturing the shoe.
Practice Problems#
8.1 A well is being drilled at 9,500 ft TVD with 10.8 ppg mud. The pore pressure at total depth is estimated to be 5,900 psi. The fracture gradient at the last casing shoe (8,000 ft TVD) is 13.5 ppg EMW.
(a) What is the current hydrostatic pressure at TD?
(b) Is the well overbalanced or underbalanced? By how much (in psi and ppg EMW)?
(c) What is the maximum mud weight that can be used without fracturing the shoe formation?
(d) A drillstem test indicates the actual pore pressure at 9,500 ft is 6,175 psi. Recalculate whether the well is currently overbalanced or underbalanced.
Solution
(a) Hydrostatic pressure:
(b) Current balance:
Pore pressure = 5,900 psi; hydrostatic = 5,335 psi.
\(5{,}335 < 5{,}900\) → the well is underbalanced by \(5{,}900 - 5{,}335 = 565\) psi.
In ppg EMW: \(\frac{565}{0.052 \times 9{,}500} = \frac{565}{494} = \mathbf{1.14 \text{ ppg}}\) underbalance.
The well is in a kick situation. The mud weight must be increased immediately.
(c) Maximum mud weight at shoe:
The maximum mud weight to stay below fracture gradient is 13.5 ppg.
(d) Recalculated with actual pore pressure:
Pore pressure = 6,175 psi; hydrostatic = 5,335 psi.
Underbalance = \(6{,}175 - 5{,}335 = \mathbf{840 \text{ psi}}\) (\(\frac{840}{494} = 1.70\) ppg underbalance).
Required mud weight to balance: \(\frac{6{,}175}{0.052 \times 9{,}500} = \frac{6{,}175}{494} = 12.5\) ppg. With a 0.3 ppg trip margin: 12.8 ppg target mud weight. This is safely below the 13.5 ppg fracture gradient limit, but the window is only \(13.5 - 12.8 = 0.7\) ppg.
8.2 While drilling at 11,200 ft TVD with 12.0 ppg mud, a kick is detected. The well is shut in with the drill bit at TD (no drill collars — simplified). The drill string volume is 540 bbl and the annular capacity is 0.0472 bbl/ft. After stabilization, SIDPP = 285 psi and SICP = 430 psi. The pit gain was 12 bbl.
(a) Calculate the BHP from SIDPP.
(b) Calculate the formation pore pressure (ppg EMW).
(c) Estimate the height of the kick.
(d) Estimate the kick fluid density. What type of kick is this most likely to be?
(e) Calculate the kill mud weight (ppg).
(f) The last casing shoe is at 9,500 ft TVD with a LOT result of 15.8 ppg EMW. Calculate the MAASP.
Solution
(a) BHP:
(b) Formation pore pressure:
(c) Kick height:
(d) Kick density:
A density of ~1.0 ppg is characteristic of a gas kick (methane gas at ~11,200 ft and ~7,274 psi has a density of approximately 0.8–1.2 ppg). This is not oil (which would be ~5–7 ppg) or saltwater (~8–10 ppg).
(e) Kill mud weight:
Round up to 12.5 ppg for operational use.
(f) MAASP:
8.3 A drilling crew detects the following signs during normal drilling at 14,000 ft TVD:
The rate of penetration suddenly increases by 50% with no change in WOB or RPM
The standpipe pressure decreases by 100 psi
The flow check shows mud flowing with pumps off
6 bbl of pit gain over the past 30 minutes
(a) List these indicators in order from least to most conclusive as evidence of a kick, and explain your reasoning.
(b) The driller stops the pumps and observes continued flow at surface. What action must be taken immediately?
(c) What is the single most important factor in limiting kick volume and complexity of the subsequent kill operation?
Solution
(a) Indicators (least to most conclusive):
Sudden increase in ROP — Least conclusive on its own. ROP can increase when drilling into softer rock, a fractured zone, a washed-out interval, or a change in formation mineralogy. However, it is also consistent with drilling into an over-pressured zone (chip hold-down effect decreases when overbalance decreases, making cutting removal easier). Should prompt increased vigilance and a flow check, but alone is not confirmation of a kick.
SPP decrease of 100 psi — Moderate concern. SPP can decrease if hole washout increases annular clearance (reducing friction), if a bit nozzle washes out (increasing nozzle area), or if the mud density decreases (gas cutting the mud in the annulus). All of these are also consistent with a kick, but other explanations exist. Warrants investigation.
6 bbl of pit gain — More conclusive. A 6 bbl gain is most likely additional fluid flowing into the well from a formation. Could theoretically result from thermal expansion of mud in a deep hot well, but this would be very small and steady. The 6 bbl gain combined with other indicators is highly suspicious.
Flow with pumps off (flow check) — Most conclusive. If mud is flowing out of the well with the pumps off, there is only one explanation: formation fluid is pushing mud out. This is confirmation of a kick. The well must be shut in immediately.
(b) Immediate action:
Shut in the well. With confirmed flow after pump stop, the crew must:
(1) Space out the drill string so a tool joint is not in the BOP (2) Close the annular preventer (or pipe rams if applicable) (3) Divert flow to choke manifold (4) Monitor and record SIDPP and SICP
Every minute of delay increases the kick volume, raises the risk of the kick reaching surface, and complicates the kill operation.
(c) Most important limiting factor:
Early detection and rapid shut-in. The volume of the kick at the time of shut-in determines the complexity of the kill operation. A 10 bbl kick can typically be managed as a routine well control event. A 100 bbl gas kick has expanded significantly, is at higher annular pressure, and may be approaching MAASP at the casing shoe. A 500 bbl kick may be approaching surface and the situation is critical.
The faster the kick is detected (through continuous monitoring of pit level, flow rate, and SPP) and the faster the well is shut in after detection, the smaller the kick volume and the simpler the kill.
8.4 Describe the events leading to a gas kick using the pressure vs. depth framework. Draw a qualitative pressure-depth diagram (describe it) showing:
(a) The mud weight pressure gradient
(b) The pore pressure gradient in a normally pressured zone
(c) The pore pressure gradient in an over-pressured gas zone (sealed trap)
(d) The moment when the bit enters the gas zone
Explain what happens to the fluid balance at the moment the bit enters the gas zone.
Solution
Qualitative pressure-depth diagram description:
The vertical axis is TVD (depth, increasing downward). The horizontal axis is pressure (increasing to the right).
Line A (mud weight): A straight line from the origin, with slope = \(0.052 \times \rho_{mud}\) (e.g., for 10 ppg mud: slope = 0.52 psi/ft). This represents the hydrostatic pressure in the wellbore.
Line B (normal pore pressure): A straight line with slope ≈ 0.433–0.465 psi/ft (fresh to light saltwater gradient). This line is to the left of Line A — the mud is always overbalanced in normally pressured zones.
Line C (over-pressured gas zone): Starting at the water-gas contact at some depth \(D_c\), the gas column above has a very shallow slope (gas gradient ≈ 0.1 psi/ft). At the contact, the pressure equals the local water gradient pressure. But moving upward through the gas, the pressure decreases very slowly. At the top of the gas column, the pressure is far to the right of both Line A and Line B — it is highly over-pressured relative to what the depth alone would suggest.
At the moment the bit enters the gas zone:
Line A (mud pressure) is still the same straight line — the mud weight has not changed. The bit has drilled through the cap rock and is now in contact with the gas zone.
In the zone immediately above the cap rock: Line A is to the right of Line B — overbalanced, everything is fine.
At the cap rock/reservoir contact: Line A meets the gas pressure curve (Line C). If the mud weight was not increased in anticipation of this pressure jump, Line A is now to the left of Line C — the formation pressure exceeds the mud pressure.
The formation is now underbalanced: gas pushes mud away from the bit face and begins flowing into the wellbore.
The flow rate increases (more material coming to the bit face), cutting size and character changes, SPP may decrease slightly (lower density fluid entering the annulus), and pit volume begins to increase. The longer this goes undetected, the larger the kick volume.
8.5 A well has been drilled to 16,000 ft TVD with the following casing program:
20-inch surface casing set at 2,000 ft TVD; LOT = 10.2 ppg EMW
13⅜-inch intermediate casing set at 9,500 ft TVD; LOT = 15.1 ppg EMW
Currently drilling with 10⅝-inch drill bit in 15.5 ppg mud
A kick is taken. SIDPP = 310 psi, SICP = 480 psi.
(a) Which casing shoe governs the MAASP? Why?
(b) Calculate the MAASP.
(c) Calculate the kill mud weight.
(d) If you use the Wait-and-Weight Method, the initial SICP is 480 psi. As kill mud fills the drill string and the pump pressure is managed via the choke, the SICP is expected to increase. If the SICP reaches MAASP, what should the crew do?
Solution
(a) Governing shoe:
The 13⅜-inch intermediate casing shoe at 9,500 ft TVD governs the MAASP. This is because it is the deepest set shoe with exposed formation below it — during the kill operation, any pressure applied at surface propagates through the entire open annulus to the shoe, and the shoe represents the weakest point (formation directly below the shoe, which has not been further reinforced by setting additional casing).
The 20-inch surface shoe at 2,000 ft with LOT = 10.2 ppg is weaker in absolute formation strength, but because it is shallow, the hydrostatic head of mud at that depth is much less, and the MAASP calculation considers the net surface pressure allowable. However, in this problem, we should check both. The critical one is whichever gives the lower MAASP.
For 13⅜-inch shoe (9,500 ft, LOT = 15.1 ppg, mud = 15.5 ppg): \(MAASP_{13-3/8} = (15.1 - 15.5) \times 0.052 \times 9{,}500 = (-0.4) \times 494 = -198\) psi.
This is negative — meaning the mud weight already exceeds the shoe fracture gradient! This is a serious problem: the mud weight necessary to control the formation pressure is above the formation strength at the intermediate casing shoe. This is a lost circulation/well control crossover scenario.
For 20-inch shoe (2,000 ft, LOT = 10.2 ppg, mud = 15.5 ppg): \(MAASP_{20} = (10.2 - 15.5) \times 0.052 \times 2{,}000 = (-5.3) \times 104 = -551\) psi. Even more negative.
Both MAASP values are negative, meaning the current mud weight already exceeds the fracture gradients at all shoe depths. This is a narrow window or lost-while-killing scenario — a genuine well control emergency requiring specialist intervention. The well cannot be killed through standard methods without risk of fracturing the shoe and creating an underground blowout.
(b) MAASP (using the 13⅜-inch shoe, since it is the most relevant):
Negative MAASP indicates that the current static mud weight has already exceeded the shoe fracture gradient. Any additional surface pressure would immediately fracture the shoe.
(c) Kill mud weight:
Round to 15.9 ppg. This is even further above the shoe fracture gradient (15.1 ppg), making standard kill operations impossible without fracturing the shoe.
(d) If SICP approaches MAASP:
With a negative MAASP, the crew has no room to apply any surface pressure without fracturing the shoe. If SICP rises toward the (already exceeded) fracture gradient:
Call the well control specialist immediately — this situation requires expert supervision.
Do not attempt to continue circulating with increased choke pressure — this will fracture the shoe and create an underground blowout.
Options include: Lubrication (bleeding gas from the casing while injecting mud to replace it, reducing the gas column height without pressuring the annulus), volumetric method (controlled bleeding to allow the gas to rise while maintaining hydrostatic pressure in the annulus using barometric control), or relief well drilling if the situation becomes uncontrolled.
This example illustrates why well control specialists and the engineering team must design the casing program with sufficient shoe strength to handle the maximum anticipated kick scenarios, including kill mud weight requirements.
Summary#
Well control ties all of drilling engineering together. Primary well control — maintaining hydrostatic overbalance through drilling fluid density — is the continuous, passive state of every well being drilled. When primary well control is temporarily compromised (a kick), secondary well control procedures use BOPs, chokes, and kill mud to safely remove the formation fluid from the wellbore and restore overbalance.
Formation pressure is not uniform: normally pressured formations are connected to a surface water body at comparable elevation; sub-normally pressured zones result from depletion or topographic effects; over-pressured zones arise from sealed traps, compaction disequilibrium, and the gas effect. Understanding these mechanisms is essential for predicting pore pressure before drilling and adjusting mud weight at the right depths.
The tools for well control diagnosis are: shut-in drill pipe pressure (SIDPP) to determine BHP; shut-in casing pressure (SICP) and pit gain to infer kick height and density; and MAASP to limit surface pressure during kill operations. The two main kill methods, Driller’s Method and Wait-and-Weight, both maintain constant bottomhole pressure by adjusting choke backpressure as heavy kill mud displaces the kick fluid.
Early detection and rapid shut-in are the single most important factors in well control: the smaller the kick volume at shut-in, the safer and simpler the kill operation.
References#
Mitchell, R.F. and Miska, S.Z. (eds.), Fundamentals of Drilling Engineering, Society of Petroleum Engineers, 2011.
Bourgoyne, A.T., Millheim, K.K., Chenevert, M.E., and Young, F.S., Applied Drilling Engineering, Society of Petroleum Engineers, 1986.
IADC Well Control Manual, International Association of Drilling Contractors, current edition.
API RP 53, Blowout Prevention Equipment Systems for Drilling Wells, American Petroleum Institute.
API RP 96, Deepwater Well Design and Construction, American Petroleum Institute.